

Analyze line graphs8A.5

Presentation
•
Mathematics
•
3rd Grade
•
Practice Problem
•
Hard
+8
Standards-aligned

Destiny Armendariz
Used 4+ times
FREE Resource
14 Slides • 12 Questions
1

2

3

4

5

6

7
Fill in the Blanks

How many more box tops were collected in Oct and Nov than in Dec and Jan?
Type answer...
8
Fill in the Blanks
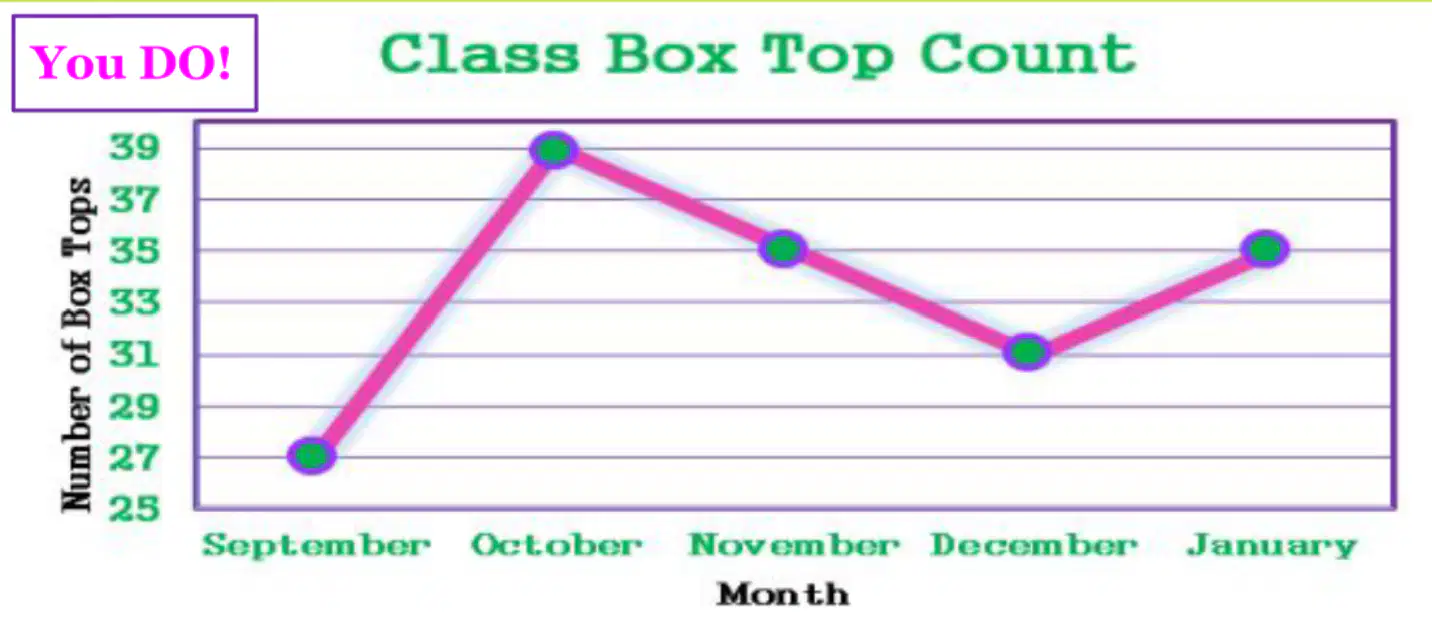
How many box tops were collected in all?
Type answer...
9
Open Ended

Partners: Create your own word problem to go with the graph.
10

11
Fill in the Blanks

What was the high temperature in Gotham City on January 10?
12
Multiple Select

On which TWO days was Gotham City’s high temperature 7° C?
13
Multiple Choice

Which of these statements about Gotham City’s high January temperatures is true?
14

15
Open Ended

In at least 3 complete sentences, explain what kind of graph you are looking at. What does it represent?
16

17
Fill in the Blanks

What is on the x-axis?
Type answer...
18
Fill in the Blanks

What is on the y- axis?
Type answer...
19
Fill in the Blanks

How old was Michael when he was 46 lbs?
20

21

22

23

24

25
Draw
26
Draw
Show answer
Auto Play
Slide 1 / 26
SLIDE

