
Algebra I Chapter 11 Test Probability and Statistics
Authored by Jennifer Jones
Mathematics
8th Grade
Used 4+ times


AI Actions
Add similar questions
Adjust reading levels
Convert to real-world scenario
Translate activity
More...
Content View
Student View
26 questions
Show all answers
1.
MULTIPLE CHOICE QUESTION
2 mins • 1 pt
The mode score on the 6th grade math test was 94! Which of these interpretations must be correct?
99 was the highest score on the test.
More students received a 94 than any other score
No student scored below a 50
A score of 91 was slightly below average.
2.
MULTIPLE CHOICE QUESTION
1 min • 1 pt
How do you find the mean of a data set?
Add the data and divide the sum by the number of data.
List in order from least to greatest
Add the numbers and subtract the largest number
Find the number that ocurrs most often in the data.
3.
MULTIPLE CHOICE QUESTION
5 mins • 1 pt
The salary of the employees in the office were $15,000; $18,000; $16,000; $14,000; $90,000; and $17,000. What is the best measure of the central tendency of the salaries?
Mean
Median
Mode
Range
4.
MULTIPLE CHOICE QUESTION
1 min • 1 pt
How do you find the median of a set of data?
Put the numbers in order from least to greatest and find the middle number.
Add all of the data together and then divide the sum by the number of data.
Find the number that ocurrs most often in the data.
Subtract the largest and smallest
5.
MATCH QUESTION
1 min • 1 pt
Match the following terms with their definitions
The lowest value of the data set
Maximum (Max)
Middle of the upper half of the data set. 75% of the data lies below this value and 25% lies below.
Minimum (Min)
Middle of the lower half of the data set. 25% of the data lies below this value and 75% lies above.
Third Quartile (Q3)
The highest value of the data set
First Quartile (Q1)
Middle of the data set. Half the data (50%) lies below this value and half (50%) lies above.
Median (Q2)
6.
MATH RESPONSE QUESTION
2 mins • 1 pt

What is the median of the data?
Mathematical Equivalence
ON
7.
MATH RESPONSE QUESTION
2 mins • 1 pt
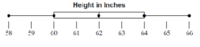
What data value is the upper quartile (Q3)?
Mathematical Equivalence
ON


Access all questions and much more by creating a free account
Create resources
Host any resource
Get auto-graded reports

Continue with Google

Continue with Email

Continue with Microsoft
or continue with

%20(1).png)
Apple

Others
By signing up, you agree to our Terms of Service & Privacy Policy
Already have an account?

