- Resource Library
- Math
- Probability And Statistics
- Shapes Of Distributions
- Decoding Data: What Shapes Can Tell Us!

Decoding Data: What Shapes Can Tell Us!
Presentation
•
Mathematics
•
9th - 12th Grade
•
Medium
+6
Standards-aligned
Joe Duncan
Used 4+ times
FREE Resource
10 Slides • 25 Questions
1
2
Open Ended
Why is it important to understand the different shapes of data distributions when analyzing information like test scores or social media likes?
3
4
Multiple Choice
Which of the following statements best describes a symmetric distribution?
Both sides of the graph match up if folded in the middle, and mean, median, and mode are at the same spot.
The graph is skewed to one side, with most data on the left or right.
The distribution has two peaks instead of one.
The data is spread out unevenly with many outliers.
5
6
Multiple Choice
Which of the following statements best describes a skewed right distribution?
Most data points are on the higher end, with a long tail to the left.
Most data points are on the lower end, with a long tail to the right.
Data is evenly distributed across all values.
Most data points are in the middle, with tails on both sides.
7
8
Multiple Choice
Compare the mean, median, and mode in a skewed left distribution. How do their values typically relate to each other?
Mean > Median > Mode
Mode > Median > Mean
Median > Mode > Mean
Mean = Median = Mode
9
10
Open Ended
How does a uniform distribution differ from skewed distributions in terms of fairness and predictability?
11
12
Multiple Choice
Which of the following distributions is most likely to occur when people have strong opinions at both extremes and few in the middle?
Uniform distribution
Skewed right distribution
U-shaped distribution
Skewed left distribution
13
14
Multiple Choice
In the context of decoding data shapes, what does the term 'tails' refer to when analyzing a dataset?
The most frequent value in the data
The middle value of the data
The ends or extremes of the data
The average value of the data
15
16
Fill in the Blanks
Data helps coaches strategize and players improve their game in
Type answer...
17
18
19
Open Ended
How might recognizing patterns in data shapes help you make smarter decisions in everyday life?
20
Multiple Choice
Based on the examples of test scores, social media scroll time, and cafeteria ratings, what does the shape of a data graph help you understand about a group’s behavior or preferences?
It shows only the highest and lowest values.
It reveals patterns and stories about how people behave or feel.
It tells you the exact reason behind every choice.
It only shows averages.
21
Fill in the Blanks
In a symmetric distribution, the mean, median, and mode are usually found at the
Type answer...
22
Multiple Choice
23
Multiple Choice

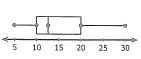
What is the shape of the data?
symmetrical
skewed left
skewed right
bell curve
24
Multiple Choice
What is the shape of the data?
symmetrical
skewed left
skewed right
bell curve
25
Multiple Choice
26
Multiple Choice
Symmetric
Right Skewed
Left Skewed
27
Multiple Choice
28
Multiple Choice
29
Multiple Choice
Which is a true statement based on the dot plots above?
Set B has the greater range
Set B has the greater median
Set B has the greater mean
Set A is less symmetric that Set B
30
Multiple Select
At Donald's Donuts the number of donut holes in a bag can vary. Help Donald find what happens when he purchases another bag with 15 in the bag. (Check all that are true)
12,10,13,12,11, 10
The mean increases
The median increases
The median stays the same
The mean decreases
31
Multiple Choice
If the standard deviation is zero, what does it indicate about the data values?
All data values are equal
Data values are close to the mean
Data values are widely spread out
Data values are skewed
32
Multiple Choice
What does a higher standard deviation indicate about the data values?
Data values are equal
Data values are less variable
Data values are more spread out from the mean
Data values are more concentrated near the mean
33
Multiple Choice
Four data sets are shown below.
Set 1: {10, 19, 38, 50, 51}
Set 2: {5, 21, 26, 39, 51}
Which data set has the higher standard deviation?
.
Set 1
Set 2
Both Set 1 and Set 2
Neither, there is no standard deviation for Set 1 and Set 2.
34
Multiple Choice
35
Open Ended
What are the key characteristics of a symmetric distribution, and why is it important to understand them when analyzing data?
Show answer
Auto Play
Slide 1 / 35
SLIDE

Similar Resources on Wayground
24 questions
Intro to Trig Ratios
Presentation
•
9th - 12th Grade
24 questions
Solving Quadratic Inequalities
Presentation
•
9th - 12th Grade
28 questions
Finals Review Part 1
Presentation
•
9th - 12th Grade
25 questions
Parent Functions
Presentation
•
9th - 11th Grade
27 questions
Intro to Triangular Similarity
Presentation
•
8th - 11th Grade
27 questions
The Other Trigonometric Functions
Presentation
•
9th - 12th Grade
25 questions
Difference of Two Squares & Perfect Squares
Presentation
•
9th - 12th Grade
27 questions
Solving exponential equations
Presentation
•
9th - 11th Grade
Popular Resources on Wayground
10 questions
Safety Day 2026 – Student Review
Quiz
•
9th Grade
21 questions
Continents and Oceans
Quiz
•
6th Grade
20 questions
Parts of Speech
Quiz
•
5th Grade
16 questions
Subject & Predicate
Quiz
•
5th Grade
25 questions
Multiplication Facts
Quiz
•
5th Grade
12 questions
Map Skills
Quiz
•
3rd Grade
22 questions
Continents and Oceans
Quiz
•
5th Grade
15 questions
Rounding Decimals
Quiz
•
5th Grade
Discover more resources for Mathematics
12 questions
Absolute Value Equations
Quiz
•
9th Grade
20 questions
Function or Not a Function
Quiz
•
8th - 9th Grade
11 questions
Slope from 2 points
Quiz
•
8th - 9th Grade
10 questions
Exploring the Basics of Exponents
Interactive video
•
6th - 10th Grade
10 questions
Solving Absolute Value Equations
Quiz
•
9th Grade
20 questions
Unit 5 Test RSC (25-26)
Quiz
•
10th Grade
18 questions
SB 12.2 Write in point slope form
Quiz
•
9th Grade
12 questions
Identify Rigid Transformations
Quiz
•
8th - 12th Grade