- Resource Library
- Math
- Probability And Statistics
- Shapes Of Distributions
- St. James 04 29 2025 Statistics Distribution & Variability
St. James 04-29-2025 Statistics Distribution & Variability
Presentation
•
Mathematics
•
6th - 8th Grade
•
Easy
+1
Standards-aligned
Antoinette Norris Woodson
Used 2+ times
FREE Resource
10 Slides • 21 Questions
1
By Antoinette Norris Woodson
2
Open Ended
Determine the Wordplexers. Write the number then the phrase. Include the example in your response.
Example: 3-skirting around the issue
3
Standards for Today
SPID.1: Select and create an appropriate display, including dot plots, histograms, and box plots, for data that includes only real numbers.
G.SPID.2: Use statistics appropriate to the shape of the data distribution to compare the center and spread of two or more different data sets that include all real numbers.
4
Open Ended
"What is each student’s favorite food?” is an example of:
Numerical Data OR Categorical Data
5
Open Ended
True or False:
A good statistical question should allow for different answers from different people.
6
Multiple Choice
Which of the following is a statistical question?
A) What is your shoe size?
B) How many people own a dog in our school?
C) What is the capital of France?
D) What is 10 + 12?
A
B
C
D
7
Multiple Choice
Which question is not statistical?
A) How many minutes do students spend doing homework each night?
B) What is your favorite animal?
C) How old am I?
D) How many siblings do students in our class have?
A
B
C
D
8
Multiple Choice
A statistical question expects:
A) One exact answer
B) Different answers and data collection
C) A yes or no answer
D) No answer
A
B
C
D
9
Open Ended
“What is the number of letters in each student’s last name?” is an example of:
Numerical Data OR Categorical Data
10
Open Ended
Write an example of your own statistical question.
(Your question should require collecting data from many people.)
11
Open Ended
Write an example of a numerical data question and a categorical data question.
12
Recognize different shapes of distributions
Understand how shape affects how we describe data
Today's Goals:
Distribution of Shapes
13
14
15
A distribution shows how data is spread out.
It tells you how often different values happen.
✏️ Write down the definition of distribution in your notebook.
What is a Data Distribution?
16
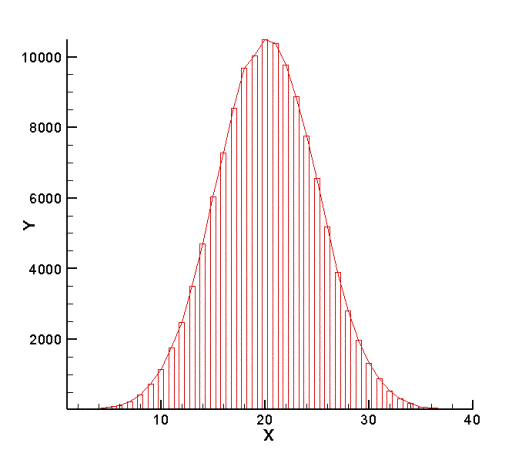
Symmetric Distributions ✏️
Both sides look the same.
Most data is close to the middle.
Real Example:
Heights of students.
17
Skewed Distributions ✏️
Skewed Right: A few big numbers pull the graph right.
Skewed Left: A few small numbers pull the graph left.
Real Examples:
Skewed Right: Housing prices.
Skewed Left: Age at retirement homes.
18
Bimodal: Two groups show up clearly (like little kids and adults in shoe size).
Uniform: Data is even everywhere (like rolling a die).
Replace this with a header
19
Types of Data Distributions ✏️
There are different shapes of distributions:
Symmetrical: Both sides are the same (mirror image).
Skewed Right: The tail is stretched to the right (higher values).
Skewed Left: The tail is stretched to the left (lower values).
Uniform: All data values occur about equally often.
Bimodal: Two distinct peaks in the data.
20
Multiple Choice
21
Multiple Choice
Describe the shape of the distribution.
symmetric
skewed left
skewed right
22
Multiple Choice
Describe the shape of the distribution.
symmetric
skewed left
skewed right
23
Multiple Choice
Describe the shape of the distribution.
symmetric
skewed left
skewed right
24
Multiple Choice
Describe the shape of the distribution.
symmetric
skewed left
skewed right
25
Multiple Choice
Describe the shape of the distribution.
symmetric
skewed left
skewed right
26
Multiple Choice
Describe the shape of the distribution.
symmetric
skewed left
skewed right
27
Multiple Choice
Describe the shape of the distribution.
symmetric
skewed left
skewed right
28
Multiple Choice
29
Multiple Choice
Choose the best description of the overall shape of the dot plot.
Skewed right
Skewed left
Symmetrical
30
Multiple Choice
31
Multiple Choice
By Antoinette Norris Woodson
Show answer
Auto Play
Slide 1 / 31
SLIDE

Similar Resources on Wayground
21 questions
Review 7.3-1 Ratios & Proportions
Presentation
•
6th - 8th Grade
23 questions
Percents
Presentation
•
6th - 7th Grade
25 questions
Equations of Proportional Relationships
Presentation
•
6th - 8th Grade
24 questions
Data- different types of graphs
Presentation
•
6th - 8th Grade
24 questions
Simplifying Expressions & Solving Equations
Presentation
•
7th - 8th Grade
24 questions
Angles of Triangles
Presentation
•
7th - 8th Grade
21 questions
Distributive Property Lesson
Presentation
•
6th - 8th Grade
21 questions
Measures of Center
Presentation
•
6th - 8th Grade
Popular Resources on Wayground
24 questions
PBIS-HGMS Day 10
Quiz
•
6th - 8th Grade
10 questions
HCS SCI 03 Summer School Review 3
Quiz
•
3rd Grade
11 questions
Home Scope
Quiz
•
7th - 8th Grade
15 questions
HCS SCI 05 Summer School Assessment 3 Review
Quiz
•
5th Grade
35 questions
Lufkin Road Middle School Student Handbook & Policies Assessment
Quiz
•
7th Grade
18 questions
Geo 11.3 Area of Circles and Sectors
Quiz
•
9th - 11th Grade