- Resource Library
- Math
- Probability And Statistics
- Median Of Grouped Data
- Mean, Mode, Median, And Range Of Ungrouped And Grouped Data
Mean, Mode, Median, and Range of Ungrouped and Grouped Data
Presentation
•
Mathematics
•
10th Grade
•
Hard

Joseph Anderson
FREE Resource
10 Slides • 11 Questions
1
Grouped Distributions
2
Multiple Choice
3
Multiple Choice
What is Xm and n in the formula of the mean for grouped data?
frequency of the mean class
Midpoint and total frequency
Classmark and frequency
Midpoint and total cumulative frequency
4
Multiple Choice
What column do we need in calculating the mean for grouped data?
Class Interval
Frequency
Cumulative Frequency
Midpoint/Classmark
5
Multiple Choice
After constructing the classmark, what is the next step?
Add the frequency and the classmark.
Subtract the frequency and the classmark.
Multiply the frequency and the classmark then add all of them together.
Divide the frequency and the classmark then add all of them together.
6
Fill in the Blanks
Type answer...
7
Fill in the Blanks
8
Fill in the Blanks
9
10
Grouped vs Ungrouped Data
An ungrouped frequency distribution is simply each data item listed in a table next to the frequency of the occurrence of that value.
Ungrouped Frequency Distributions - used for data that can be enumerated and when the range of values in the data set is not large.
A grouped distribution is a way of organising a large set of data into smaller, more manageable groups.
A Grouped Frequency Distribution is used when the range of data values in the data set is large.
11
Example
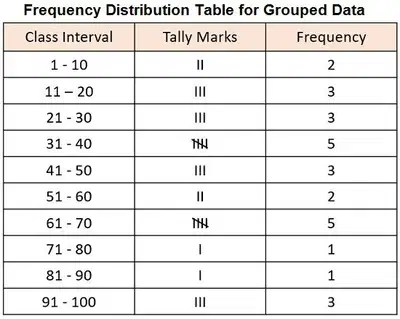
Consider the marks obtained by students in an examination where the maximum marks of the exam are 100.
22, 65, 32, 36, 28, 17, 15, 64, 86, 52, 36, 55, 9, 48, 65, 96, 14, 6, 37, 69, 76, 49, 37, 46, 21, 67, 92, 98
If we create a frequency distribution table for each and every data item, then it will form a large table with one row for each data item
So for easy understanding, we can make a table with groups of data items
12
Class Intervals
The data is grouped into classes. The table shown contains 10 classes
Each class is recorded as a class interval so for example the 3rd class interval is 21-30
Note that the class intervals do not overlap when working with discrete data
13
Class Limits
The smallest and largest values of a class are called the class limits.
Class limits are actual data values.
21 and 30 are the class limits of the 3rd class interval
14
Class Boundaries
Class boundaries provide values that eliminate gaps between the class intervals
Class boundaries are not actual data values
To find a class boundary, average the upper class limit of one class and the lower class limit of the next class
the class boundaries of the 3rd class are 20.5 and 30.5
15
Class width
Each class interval has a class width
The class width is the difference between the class boundaries
The width of the class in the table shown is 30.5-20.5 = 10
16
Class Midpoint
The class midpoint is calculated by finding the mean of the upper and lower class limits (or boundaries).
17
Mean, Median, and Mode of Grouped Data & Frequency Distribution Tables Statistics
Video: https://youtu.be/zjHfAhcU6kE
18
Multiple Choice
Calculate mean for the above given data.
1.6
1.4
1.3
1.8
19
Multiple Choice
Find the mean.
10
20
30
40
20
Multiple Choice
Find the estimated mean from the following table...
You may need to copy the table out and add columns...
28.5
31.5
30.5
29.5
21
Multiple Choice
53.75
54.375
55.575
56.45
Grouped Distributions
Show answer
Auto Play
Slide 1 / 21
SLIDE

Similar Resources on Wayground
15 questions
Parallel Construction
Presentation
•
10th Grade
16 questions
Scatter Plots & Correlation
Presentation
•
9th Grade
14 questions
Area of Triangles and Parallelograms
Presentation
•
9th Grade
14 questions
Domain and Range of Continuous Data with Endpoints
Presentation
•
9th Grade
16 questions
Photosynthesis and Cellular Respiration
Presentation
•
10th Grade
18 questions
Patterns, Functions and Function Application
Presentation
•
10th Grade
16 questions
M4 Logic: Conditional Statements
Presentation
•
10th Grade
16 questions
4.4 Congruent Triangles by ASA and AAS
Presentation
•
10th Grade
Popular Resources on Wayground
24 questions
PBIS-HGMS Day 10
Quiz
•
6th - 8th Grade
10 questions
HCS SCI 03 Summer School Review 3
Quiz
•
3rd Grade
11 questions
Home Scope
Quiz
•
7th - 8th Grade
15 questions
HCS SCI 05 Summer School Assessment 3 Review
Quiz
•
5th Grade
35 questions
Lufkin Road Middle School Student Handbook & Policies Assessment
Quiz
•
7th Grade
18 questions
Geo 11.3 Area of Circles and Sectors
Quiz
•
9th - 11th Grade