PPC Part 2
Presentation
•
Social Studies
•
12th Grade
•
Practice Problem
•
Easy
Jana Lane
Used 3+ times
FREE Resource
17 Slides • 15 Questions
1
Production Possibilities Curve
2
●
I can define: Production Possibilities Curve, Efficient, Growth,
Inefficient
●
I can illustrate: a point on a PPC, growth on a ppc.
●
I can explain how a PPC shows opportunity cost.
Learning Targets
3
●
A curve that shows the opportunity cost between two things you can produce.
Production Possibilities Curve
4
To make a PPC:
●
Determine your most likely production options.
●
Determine how much you can make of each if you just focused on one product at a time.
●
Plot your maximums.
●
Connect your maximums with a curve.
Production Possibilities Curve
5
6
Draw this on your note paper:
We are going to make a PPC for
Dairy Queen.
Production Possibilities Curve
7
Draw
Draw a PPC for Dairy Queen in which a worker can make a maximum of 100 hamburgers or 80 blizzards in an hour.
8
The curve represents all the places
you can possibly produce.
A point on the curverepresents where
you choose to produce at any given
moment.
Production Possibilities Curve
9
10
PPCs show that if you want to make
more of one product, you have to give
up some of another.
If we want to make more blizzards,
what is our opportunity cost?
Production Possibilities Curve
11
12
Point location:
The restaurant is closed.
The restaurant is making hamburgers
only.
The restaurant is splitting between
both products.
The restaurant is making mostly
blizzards.
Production Possibilities Curve
13
14
The curve represents all the places
you can possibly produce.
A point on the curve represents
where you are choosing to produce
at any given moment.
Any point on the curve is efficient.
Any point inside the curve is
inefficent.
Production Possibilities Curve
15
16
What if we improved our technology
or training?
Now we get a new maximum.
That’s growth.
Production Possibilities Curve
17
Growth on a PPC is caused by:
●
More resources (capital goods)
●
Improved technology
●
Improved worker training
Production Possibilities Curve
18
Draw
Draw growth on a PPC.
19
I can define: Production Possibilities Curve, Efficient, Growth, Inefficient
I can illustrate: a point on a PPC, growth on a ppc.
I can explain how a PPC shows opportunity cost.
Learning Targets
20
Match
Match the terms and definitions:
Production Possibiilties Curve
Growth
Inefficient
Impossible
A point on PPC
A graph that shows the maximum amount of two goods that a business can produce
An increase in the amount of goods and services produced over time
Point behind the line, below maximum
Any point outside the line
The current choice for production
A graph that shows the maximum amount of two goods that a business can produce
An increase in the amount of goods and services produced over time
Point behind the line, below maximum
Any point outside the line
The current choice for production
21
Hotspot
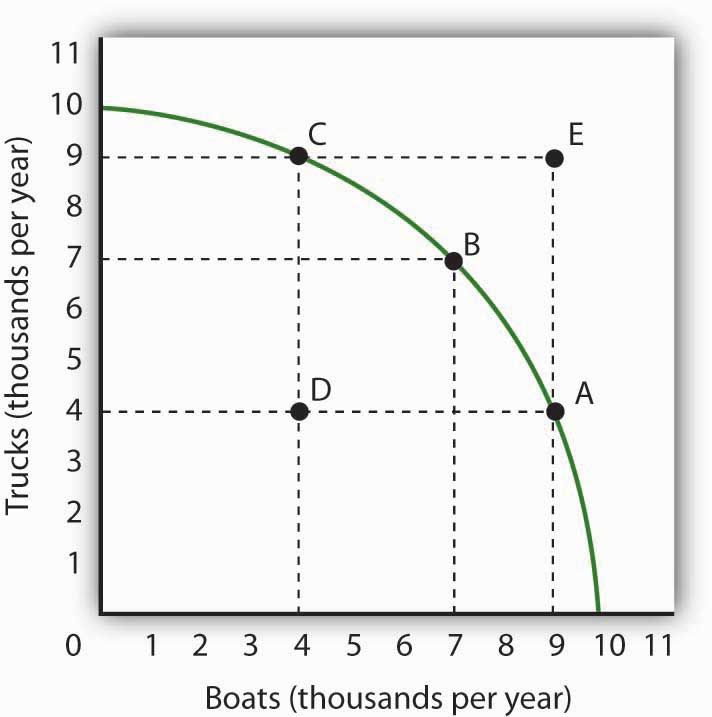
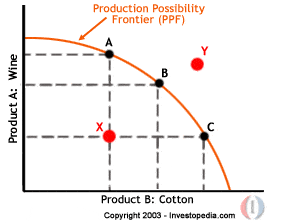
Identify the point or points on the graph that are efficient.
22
Hotspot
Identify the point or points on the graph that are inefficient.
23
Hotspot
Identify the point or pointss on the graph that are impossible.
24
Draw
Draw a point on the graph that represents growth.
25
Open Ended
What is something that might cause a PPC to shift inward? (This is a stretch question, so make your best guess).
26
Open Ended
After the pandemic, the government began an “Internet for All” program, committing $65 billion dollars to expand internet access across the country.
How would this impact the PPC?
27
Multiple Choice
The table shows the production possibilities for a country. Based on the table, which of the following production combinations is a possibility?
28 pizzas and 5 pairs of shoes
3 pairs of shoes and 23 pizzas
2 pairs of shoes and 20 pizzas
4 pairs of shoes and 15 pizzas
28
Multiple Choice
29
Multiple Choice
30
Multiple Choice
31
Multiple Choice
What will be the maximum number of capital goods the country can produce if it devotes all its resources to making capital goods?
30
60
75
100
32
Multiple Choice
Production Possibilities Curve
Show answer
Auto Play
Slide 1 / 32
SLIDE

Similar Resources on Wayground
28 questions
Articles of Confederation
Presentation
•
11th Grade
26 questions
1.1: Evolutionary Psychology Lesson
Presentation
•
12th Grade
24 questions
Human rights
Presentation
•
12th Grade
23 questions
Lesson 1.3
Presentation
•
12th Grade
22 questions
ECONOMICS TOPIC 3 LESSON 2
Presentation
•
12th Grade
24 questions
Supply
Presentation
•
12th Grade
24 questions
World War II: The War in Europe
Presentation
•
11th Grade
23 questions
Reign of Terror
Presentation
•
12th Grade
Popular Resources on Wayground
24 questions
PBIS-HGMS Day 10
Quiz
•
6th - 8th Grade
10 questions
HCS SCI 03 Summer School Review 3
Quiz
•
3rd Grade
11 questions
Home Scope
Quiz
•
7th - 8th Grade
15 questions
HCS SCI 05 Summer School Assessment 3 Review
Quiz
•
5th Grade
35 questions
Lufkin Road Middle School Student Handbook & Policies Assessment
Quiz
•
7th Grade
18 questions
Geo 11.3 Area of Circles and Sectors
Quiz
•
9th - 11th Grade