Analyzing Lines of Best Fit of Scatterplots
Presentation
•
Mathematics
•
8th Grade
•
Practice Problem
•
Medium
+3
Standards-aligned
Larry Walker
Used 9+ times
FREE Resource
3 Slides • 8 Questions
1
2
Multiple Choice
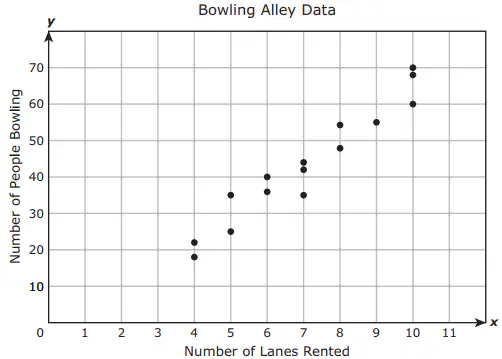
1. The daily attendance at a bowling alley was recorded for 15 days. The scatterplot shows the number of lanes rented each day and the number of people who bowled that day. Which statement is best supported by the scatterplot?
UNIT 3 QUIZ PART 1 - 86% CORRECT
There is a non-linear association between the number of lanes rented and the number of people who bowl.
There is a negative linear association between the number of lanes rented and the number of people who bowl.
There is no apparent association between the number of lanes rented and the number of people who bowl.
There is a positive linear association between the number of lanes rented and the number of people who bowl.
3
Multiple Choice
2. Which scatterplot does NOT suggest a linear association between y and x?
UNIT 3 QUIZ PART 1 - 71% CORRECT
4
Multiple Choice
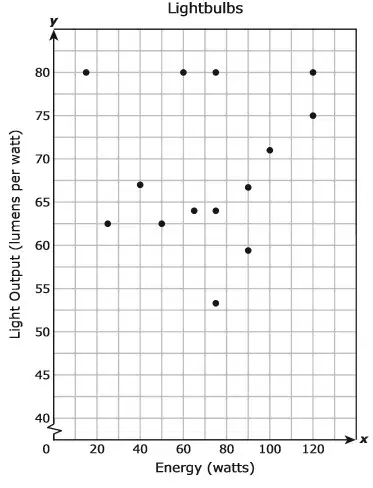
3. The scatterplot shows the energy used in watts and the light output in lumens per watt of several light-bulbs. Which statement best describes the association between the energy and light output of these light-bulbs?
UNIT 3 QUIZ PART 1 - 71% CORRECT
As the energy increases, the light output increases.
As the energy increases, the light output decreases.
As the energy increases, the light output remains the same.
There is no apparent association between the energy and light output.
5
DIRECTIONS: Watch the video and take notes of the vocabulary and determining lines of best fit.
Video Notes:
Scatter-plot Graphs - "Lines of Best Fit"
6
Draw
INDEPENDENT PRACTICE
5. The following scatter-plot represents the number of calories and total fat in grams for specific sandwich meals.
Make an estimate of the “line of best fit” with a different color that holds majority of the data points.
7
Open Ended
PARTNER PRACTICE: Think-Write-Share
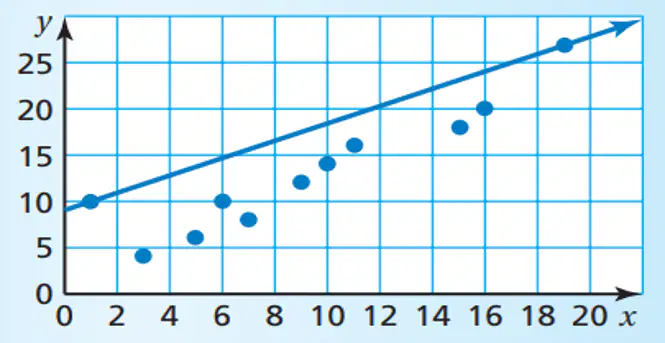
6. Describe in complete sentences the error that was made in making the “line of best fit” for the given scatter-plot displayed.
8
9
Drag and Drop
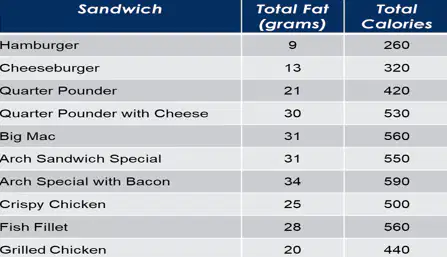
11. Drag and drop the following values of the scatter-plot representation.
REMEMBER: Use y1 ~ mx1 + b on DESMOS Graphing Calculator.
y-intercept (b):
10
Math Response
PARTNER PRACTICE
12. Determine the linear equation in slope-intercept form of the scatter-plots line of best fit.
Round values of the nearest whole number.
HINT: Slope-Intercept Form: y=mx+b
11
Multiple Choice
EXIT TICKET 12/02 - TEK 8.5D
The table shows the distance you travel over a 6-hour period.
Which linear equation that represents the line of best fit of the data set.
y= 55x + 12
y= 12x + 55
y= 55x - 12
y= -55x + 12
Show answer
Auto Play
Slide 1 / 11
SLIDE

Similar Resources on Wayground
10 questions
Linear vs Nonlinear Tables
Presentation
•
8th Grade
9 questions
Point Slope Form
Presentation
•
8th - 9th Grade
10 questions
Lesson 6.3 Rotations
Presentation
•
8th Grade
9 questions
Vertical and Supplementary Angles
Presentation
•
8th Grade
10 questions
Finding Slope
Presentation
•
7th - 8th Grade
11 questions
Reflection Rules
Presentation
•
8th Grade
9 questions
Solving Equations
Presentation
•
8th Grade
10 questions
Lesson 1.5: Equations with Cube and Square Roots
Presentation
•
8th Grade
Popular Resources on Wayground
24 questions
PBIS-HGMS Day 10
Quiz
•
6th - 8th Grade
10 questions
HCS SCI 03 Summer School Review 3
Quiz
•
3rd Grade
11 questions
Home Scope
Quiz
•
7th - 8th Grade
15 questions
HCS SCI 05 Summer School Assessment 3 Review
Quiz
•
5th Grade
35 questions
Lufkin Road Middle School Student Handbook & Policies Assessment
Quiz
•
7th Grade
18 questions
Geo 11.3 Area of Circles and Sectors
Quiz
•
9th - 11th Grade