


Correlation Coefficient
Presentation
•
Mathematics
•
9th Grade
•
Practice Problem
•
Medium
+4
Standards-aligned
Sean Tarter
Used 9+ times
FREE Resource
12 Slides • 32 Questions
1
Correlation Coefficient
​
2
Correlation tests for a relationship between two variables.
3
Causation means that one thing "causes" another
4
Multiple Choice
A correlation shows that two things
Are Related
Cause Each Other to Happen
Are Unrelated
5
Multiple Choice
This implies that one variable has a direct affect on the other variable.
Correlation
Causation
6
Study Time and Grades
As study hours increase, grades increase. There is a positive correlation between hours and grades.
So....Do hours spent studying cause higher grades?
7
Ice Cream Sales and Shark Attacks
As ice cream sales increase, shark attacks increase. As ice cream sales decrease, shark attacks decrease.
So....ice cream sales cause shark attacks?
8
Correlation vs. Causation
Causation means that x makes y happen. For example, the more cash you spend, the less cash you will have. This example has a correlation AND causation.
BUT… Correlation ≠ Causation.
Example: There may be a correlation between the number of glue sticks in a classroom and the number of students in a classroom. However, adding glue sticks to a classroom does not make more students be in the classroom.
9
Multiple Choice
Correlation or Causation?
The number of times you come to tutoring and your test scores improving
Correlation
Causation
10
Multiple Choice
Correlation or Causation?
The inches of snowfall and the number of heart attacks
Correlation
Causation
11
Multiple Choice
Correlation or Causation?
The speed you drive and the amount of fuel you use
Correlation
Causation
12
Multiple Choice
Which example shows CAUSATION? (Which one CAUSED the other to happen.)
High social media usage and reduced grades.
Car ran out of gas and being stranded on the side of the road.
Recess time and number of friends.
13
Multiple Choice
Which example shows CAUSATION? (Which one CAUSED the other to happen.)
Rainfall and time spent reading.
Eating more butter and increased divorce rates.
It started raining and the baseball game was delayed.
14
Multiple Choice
Which one of these examples is NOT an example of CAUSATION?
Kryptonite causes Superman to lose all his powers.
Temperatures of less than 32˚F cause water to freeze.
Umbrellas cause rainstorms.
Stepping on the gas pedal causes a car to move faster.
15
Positive Association | Negative Association | No Correlation |
|---|---|---|
Both variables are increasing. | One variable is increasing, the other is decreasing. | There is no relationship between the variables. |
Types of Correlation
16
Multiple Choice
17
Multiple Choice
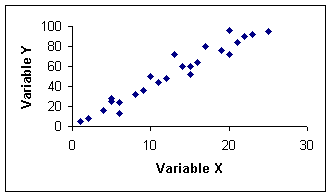
18
Multiple Choice
Number of days absent from school vs. math average
Positive Correlation
Negative Correlation
No Correlation
19
Multiple Choice
20
Multiple Choice
Amount of Education and Amount of income
Positive Correlation
Negative Correlation
No Correlation
21
Multiple Choice
Which scatter plot shows a linear relationship between x and y?
Graph A
Graph B
Graph C
Graph D
22
Correlation Coefficient (r)
Correlation Coefficient (r) describes the strength and direction of the correlation.
r values can not be less than -1 or greater than +1. This can be written as the inequality -1 < r < 1
23
The closer to 0, the weaker the correlation. Very close to 0 is no correlation. The closer to -1 or 1, the stronger the correlation. -1 and 1 are perfect.
24
Correlation coefficient (r) formulas are used to find how strong a relationship is between data. The formulas return a value between -1 and 1, where:
1 indicates a strong positive relationship.
-1 indicates a strong negative relationship.
A result of zero indicates no relationship at all.
25
Multiple Choice
Average time spent listening to music per day and average time spent watching TV per day. r=−.17
strong positive
strong negative
weak positive
weak negative
26
Multiple Choice
Score on science exam and number of words written on the essay question. r=.28
strong positive
strong negative
weak positive
weak negative
27
Multiple Choice
Car weight and distance traveled using a full tank of gas. r=−.86
strong positive
strong negative
weak positive
weak negative
28
Multiple Choice
Number of steps taken per day and number of kilometers walked per day. r=.92
strong positive
strong negative
weak positive
weak negative
29
Multiple Choice
30
Multiple Choice
Test scores vs. shoe sizes
Positive Correlation
Negative Correlation
No Correlation
31
Match
Non-linear Correlation
No Correlation
Positive, Linear Correlation
Negative, Linear Correlation
Non-linear Correlation
No Correlation
Positive, Linear Correlation
Negative, Linear Correlation
32
Multiple Choice
33
Multiple Choice
34
Multiple Choice
Which graph depicts the strongest positive correlation?
35
Multiple Choice
Estimate the correlation coefficient for this scatterplot.
A) r = -0.9
B) r = 1
C) r = 0.9
D) r = -1
36
Multiple Choice
37
To show the overall trend of a data set, we can use a Line of Best Fit.
A line of best fit should:
Follow the trend of the data
Split the data in half
Help to estimate or predict values that are not already given in the set.
Line of Best Fit
38
Multiple Choice
Is this line an accurate line estimate of best fit for the data?
Yes
No
39
Multiple Choice
Which of the following lines represents the line of best fit for the scatter plot?
A
B
C
D
40
Multiple Choice
Which of the following lines represents the line of best fit for the scatter plot?
A
B
C
D
41
Multiple Choice
Which of the following lines represents the line of best fit for the scatter plot?
A
B
C
There is no line of best fit for this graph because there is no trend.
42
Multiple Choice
Select the statement that best describes the line.
The line is the line of best fit.
The line is NOT a line of best fit because it does not pass through two points.
The line is NOT a line of best fit because it does not go through the middle of the data set.
The line is NOT a line of best fit because it does not go through the origin.
43
Outliers | Clusters |
|---|---|
An outlier is a data point in a scatter plot that does not follow the trend of the data. | A group of data points that are closely grouped together. |
outlier
cluster
44
Multiple Choice
What are the coordinates of the outlier?
(1,9)
(9,1)
(2,2)
y=x
Correlation Coefficient
​
Show answer
Auto Play
Slide 1 / 44
SLIDE

Similar Resources on Wayground
40 questions
Circle Vocabulary Part 1
Presentation
•
10th Grade
38 questions
Solving Quadratic Equations
Presentation
•
9th Grade
40 questions
COAL Friday 11/6
Presentation
•
9th Grade
34 questions
Linear, Quadratic, or Exponential?
Presentation
•
9th Grade
40 questions
Polynomial Operations
Presentation
•
9th - 10th Grade
38 questions
Mitosis
Presentation
•
9th Grade
42 questions
linear transformations
Presentation
•
9th Grade
36 questions
Rules with Exponents
Presentation
•
9th Grade
Popular Resources on Wayground
24 questions
PBIS-HGMS Day 10
Quiz
•
6th - 8th Grade
10 questions
HCS SCI 03 Summer School Review 3
Quiz
•
3rd Grade
11 questions
Home Scope
Quiz
•
7th - 8th Grade
15 questions
HCS SCI 05 Summer School Assessment 3 Review
Quiz
•
5th Grade
35 questions
Lufkin Road Middle School Student Handbook & Policies Assessment
Quiz
•
7th Grade
18 questions
Geo 11.3 Area of Circles and Sectors
Quiz
•
9th - 11th Grade

