Benchmark 3 8th Grade
Presentation
•
Mathematics
•
8th Grade
•
Easy
+15
Standards-aligned
Sheree Robinson
Used 1+ times
FREE Resource
11 Slides • 35 Questions
1
Benchmark 3 Review
Functions, Volume, Scatter Plots, and Two-way Tables
2
Finding the Rate of Change (Slope)
3
Multiple Choice
What is the slope of the equation y = -3x + 8
8
-3
No Slope
Undefined
4
Multiple Choice
-5/4
5/4
-4/5
4/5
5
Multiple Choice
Find the slope from the table.
-4
1
4
-2
6
Comparing Functions
Find the Rate of Change (Slope) for each function.
Find the y-intercept for each function
See which one is greater or less based on the question.
7
Which Function has a lower rate of change?
8
Multiple Choice
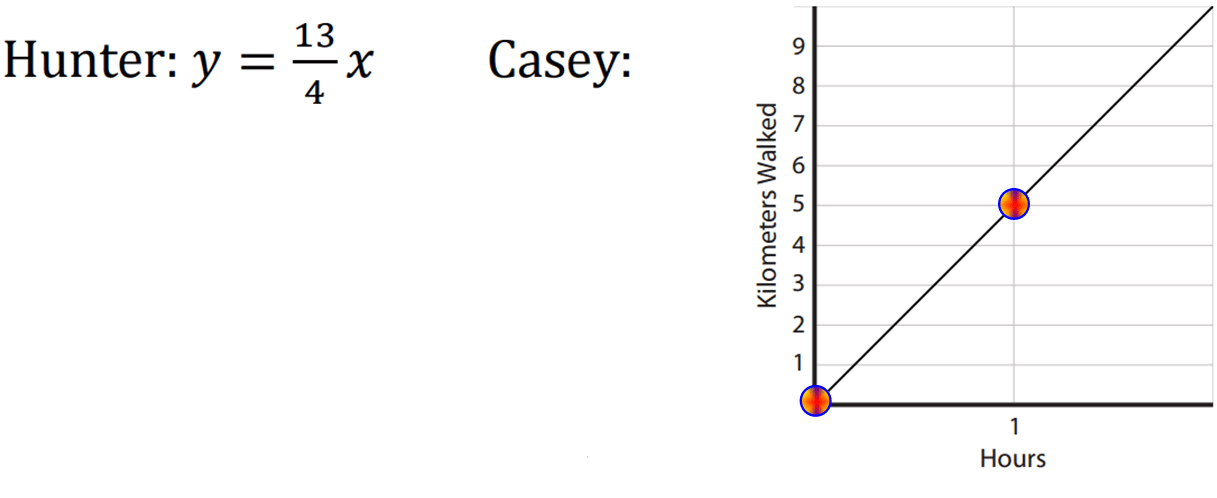
Function A is represented by the equation.
Function B is represented by the graph.
Which function has the greater y-intercept?
Function A
Function B
Neither. They have the same y-intercept.
There is not enough information to answer this question.
9
Multiple Choice
Who has the greater rate of change?
Hunter has the greater rate of change.
Casey has the greater rate of change
They have the same rate of change
10
Multiple Choice
Mochi
Kappa
11
Multiple Choice
Valerie
Oscar
They are losing the same amount of weight
12
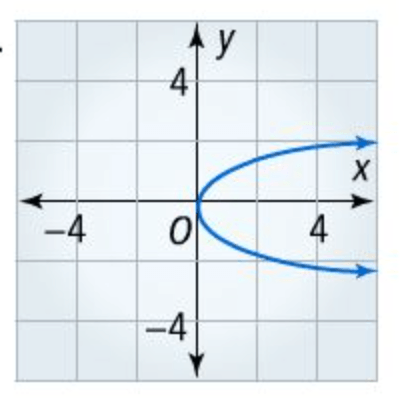
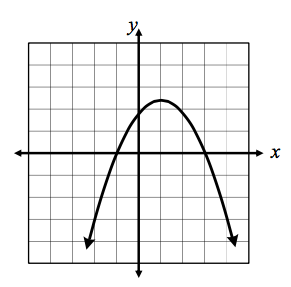
These are all functions
EACH X VALUE (input)
HAS ONLY ONE Y VALUE (output)
13
These are NOT functions
In each example, there is one X VALUE (input) that has more than one Y VALUE (output)
14
Multiple Choice
Has inputs and outputs
Every input(x) has only ONE output(y)
Inputs have different outputs every time
x-values and y-values
15
Multiple Choice
Is this graph a function or not a function?
Function
Not a Function
16
Multiple Choice
Function
Not a Function
17
Multiple Choice
Function
Not a Function
18
Multiple Choice
Function
Not a Function
19
Multiple Choice
(9,5) (10,5) (9,-5) (10,-5)
(3,4) (4,-3) (7,4) (3, 8)
(6,-5) (7, -3) (8, -1) (9, 1)
(2, -2) (5, 9) (5, -7) (1, 4)
20
Multiple Choice
Between 7 and 12 seconds
Between 0 and 1 seconds
Between 1 and 5.5 seconds
Between 12 and 13.5 seconds
21
Multiple Choice
Between 7 and 12 seconds
Between 0 and 4 seconds
Between 1 and 5 seconds
Between 12 and 13.5 seconds
22
Multiple Choice
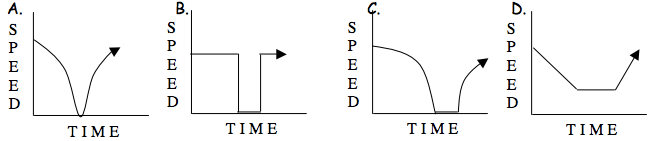
Which graph below could match the situation described?
Select a graph for the situation.
You wait for the express bus for 30 minutes, get on and ride the bus non-stop for 3 miles, and then walk another mile to your home.
23
Multiple Choice
A
B
C
D
24
25
Multiple Choice
Graph A
Graph B
Graph C
Graph D
26
Multiple Choice
Yes
No
27
Multiple Choice
The scatter plot below shows the number of books read by students in Ms. Honor’s English class and their final grades. Which statement represents the best description about the line of best fit or trend?
The more books students read, the lower their English grade.
The more books students read, the higher their English grade.
The fewer books students read, the higher their English grade.
No relationship exists between the number of books students read and their English grades.
28
Multiple Choice
Which of the following lines represents the line of best fit for the scatter plot?
A
B
C
D
29
Multiple Choice
Which of the following lines represents the line of best fit for the scatter plot?
A
B
C
D
30
Multiple Choice
Which of the following lines represents the line of best fit for the scatter plot?
A
B
C
There is no line of best fit for this graph because there is no trend.
31
Multiple Choice
y = −25 x + 20
y = -x + 19
y = x + 20
y = 32 x + 15
32
Multiple Choice
6
50
55
59
33
Multiple Choice
A teacher made the following graph showing the number of hours that a student studied for an exam versus their exam grade. Use the Line of Best Fit to predict the amount of hours to study to make a grade of 100.
2
3.5
4.5
4
34
Two-Way (Contingency) Table
Organizes categorical data
Used to summarize relationships between categorical variables
35
36
37
Multiple Choice
About 20%
About 18%
About 14%
About 12%
38
Multiple Choice
What number should go in the blue box?
21
135
19
22
39
Multiple Choice
How many total have no cell phone?
13
9
22
100
40
Multiple Choice
How many total have an MP3 player?
13
57
70
100
41
Multiple Choice
How many total people were surveyed?
78
22
70
100
42
Labelling
Fill in the missing values.
43
44
Multiple Choice
Find the volume of the Cone.
30,520.8 km3
122,083.2 km3
45
Multiple Choice
Find the Volume of the Sphere
904.32 ft3
7,234.56 ft3
150.72 ft3
46
Multiple Choice
Volume = ?
1,077.02 yd3
269.255 yd3
153.86 yd3
Benchmark 3 Review
Functions, Volume, Scatter Plots, and Two-way Tables
Show answer
Auto Play
Slide 1 / 46
SLIDE

Similar Resources on Wayground
42 questions
Review/Preview Week 2
Presentation
•
8th Grade
42 questions
Metamorphic Rocks Lesson
Presentation
•
8th Grade
39 questions
Credit, Debit, & Credit Scores
Presentation
•
8th Grade
43 questions
Bill of Rights
Presentation
•
8th Grade
41 questions
Parallel Lines & Transversals
Presentation
•
8th Grade
39 questions
TERRIFIC THURSDAY WITH MR. HOWARD!!!
Presentation
•
8th Grade
37 questions
Angle relationships
Presentation
•
8th Grade
40 questions
Causes of the War of 1812
Presentation
•
8th Grade
Popular Resources on Wayground
24 questions
PBIS-HGMS Day 10
Quiz
•
6th - 8th Grade
10 questions
HCS SCI 03 Summer School Review 3
Quiz
•
3rd Grade
11 questions
Home Scope
Quiz
•
7th - 8th Grade
15 questions
HCS SCI 05 Summer School Assessment 3 Review
Quiz
•
5th Grade
35 questions
Lufkin Road Middle School Student Handbook & Policies Assessment
Quiz
•
7th Grade
18 questions
Geo 11.3 Area of Circles and Sectors
Quiz
•
9th - 11th Grade