Interpreting Motion Graphs
Presentation
•
Physics
•
9th - 12th Grade
•
Medium
Standards-aligned
Robert Johnson
Used 271+ times
FREE Resource
0 Slides • 18 Questions
1
Multiple Choice
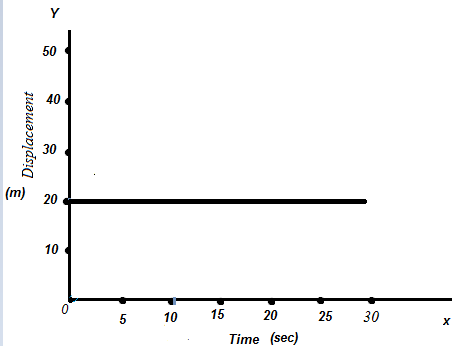
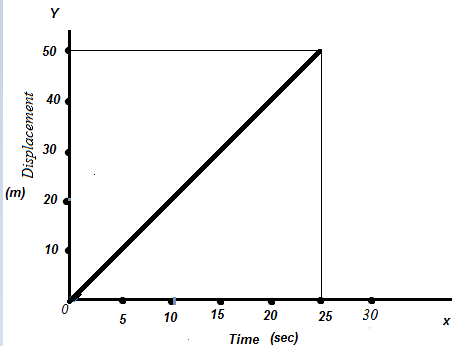
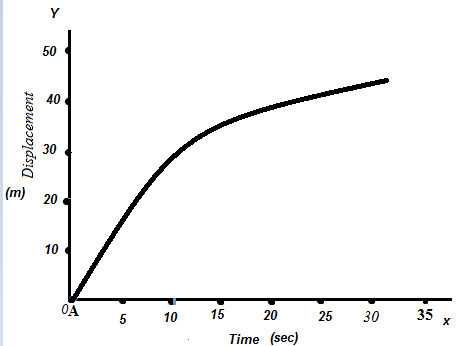
What is shown in this displacement vs time graph?
uniform velocity
uniform speed
no speed (at rest)
acceleration
2
Multiple Choice
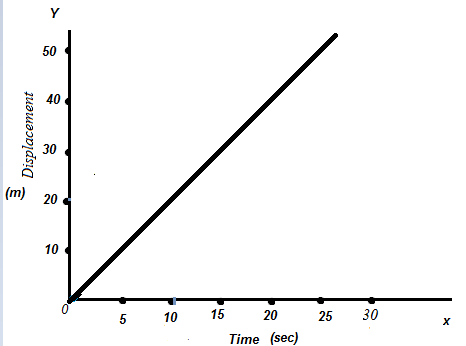
What does this graph mean?
no velocity (at rest)
uniform velocity
uniform speed
3
Multiple Choice
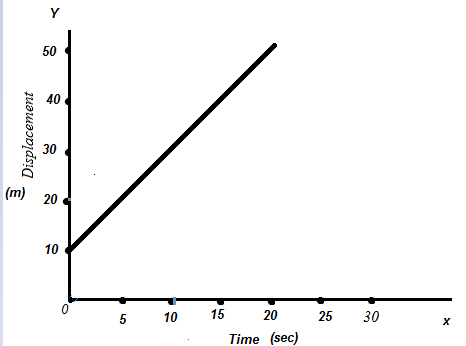
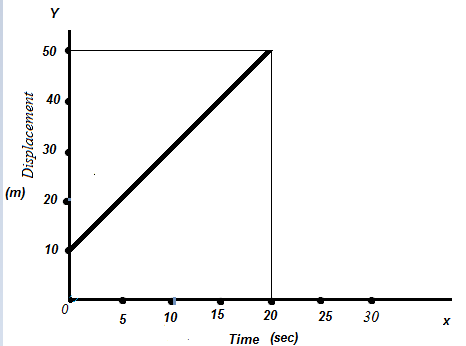
What is shown in this graph?
uniform velocity and initial displacement 10m
uniform velocity and initial velocity 10m
acceleration
4
Multiple Choice
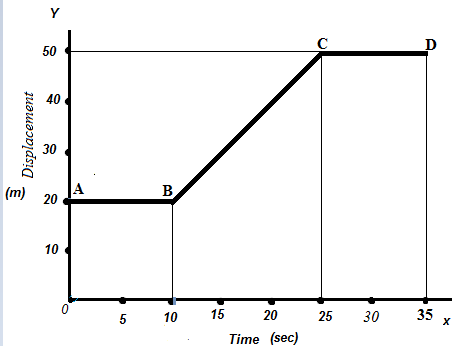
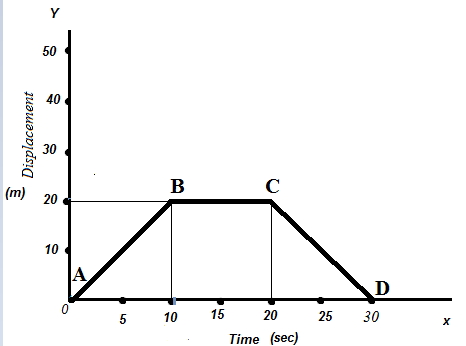
What is happening between B and C in this graph?
constant acceleration
uniform velocity
at rest
5
Multiple Choice
What is happening between C and D in this graph?
constant acceleration
uniform velocity
at rest
6
Multiple Choice
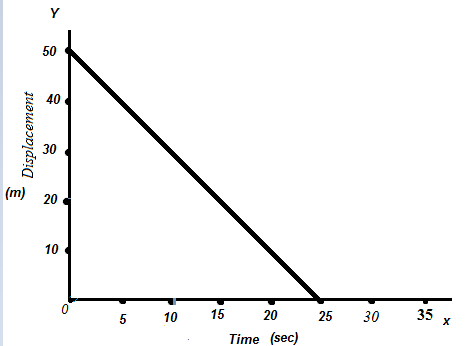
What is happening in this graph?
constant positive velocity
constant negative velocity
negative acceleration
gravity
7
Multiple Choice
What is happening from A to B?
acceleration
uniform velocity
uniform acceleration
8
Multiple Choice
What is happening from B to C?
acceleration
uniform negative velocity
uniform acceleration
9
Multiple Choice
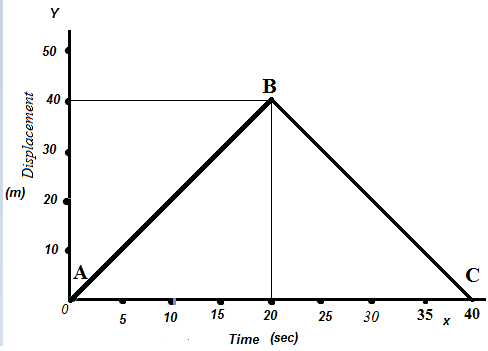
What is happening from A to B, from B to C and from C to D in the given graph?
A to B uniform positive velocity, B to C at rest, C to D uniform negative velocity
A to B positive acceleration, B to C no acceleration and C to D negative acceleration
A to B high speed, B to C low speed, C to D very low speed
10
Multiple Choice
Find the velocity from the given graph.
2 m/s
21 m/s
100 m/s
-2m/s
11
Multiple Choice
Find the velocity from the given graph.
2 m/s
-2m/s
2.5m/s
12
Multiple Choice
Find the velocity from the given graph.
-2m/s
−21 sm
2m/s
13
Multiple Choice
what does this graph show?
positive acceleration
negative acceleration (deceleration)
positive uniform velocity
negative uniform velocity
14
Multiple Choice
what is shown in this graph?
negative velocity
positive velocity
negative acceleration deceleration
positive acceleration
15
Multiple Choice
Calculate the displacement traveled in section C. Hint: Remember the area under a v-t graph = displacement and you will need to use TWO shapes!
200 m
100 m
50 m
400 m
16
Multiple Choice
Use the graph above and pick the most accurate description of the object's motion
object is moving at constant speed
object is speeding up
object is at rest
object is slowing down
17
Multiple Choice
Use the picture above to choose the most accurate description of the object's motion
object is at rest
object is slowing down
object is moving at a constant speed
object is speeding up
18
Multiple Choice
Use the picture to choose the most accurate description of the object's motion
object is moving at constant speed in the positive direction
object is speeding up in the negative direction
object is speeding up in the positive direction
object is slowing down in the negative direction
What is shown in this displacement vs time graph?
uniform velocity
uniform speed
no speed (at rest)
acceleration
Show answer
Auto Play
Slide 1 / 18
MULTIPLE CHOICE

Similar Resources on Wayground
15 questions
Work, Energy, & Power Review
Presentation
•
8th - 12th Grade
13 questions
Graphing Quadratics in Standard Form
Presentation
•
9th - 12th Grade
12 questions
Discriminant
Presentation
•
9th - 12th Grade
12 questions
Unit 7 Review
Presentation
•
9th - 12th Grade
13 questions
HP 6-1 Simple Machines
Presentation
•
9th - 12th Grade
14 questions
Ohm's Law
Presentation
•
9th - 12th Grade
11 questions
Equations of Circles
Presentation
•
9th - 12th Grade
14 questions
Archimedes' Principle
Presentation
•
9th - 12th Grade
Popular Resources on Wayground
24 questions
PBIS-HGMS Day 10
Quiz
•
6th - 8th Grade
10 questions
HCS SCI 03 Summer School Review 3
Quiz
•
3rd Grade
11 questions
Home Scope
Quiz
•
7th - 8th Grade
15 questions
HCS SCI 05 Summer School Assessment 3 Review
Quiz
•
5th Grade
35 questions
Lufkin Road Middle School Student Handbook & Policies Assessment
Quiz
•
7th Grade
18 questions
Geo 11.3 Area of Circles and Sectors
Quiz
•
9th - 11th Grade