Search Header Logo
  1. Resource Library
  2. Math
  3. Data And Graphing
  4. ...
  5. Md.2 Line Graphs
MD.2 Line Graphs

MD.2 Line Graphs

Assessment

Presentation

•

Mathematics

•

5th Grade

•

Easy

•
CCSS
HSF.IF.B.4, 5.G.A.2

Standards-aligned

Created by

Alicia Heesch

Used 9+ times

FREE Resource

2 Slides • 5 Questions

1

MD.2 Line Graphs

By Alicia Van Heesch

2

3

Multiple Choice

Question image

How many degrees did the temperature increase between 2:00pm and 4:00pm?

1

6 degrees

2

80 degrees

3

79 degrees

4

4 degrees

4

Multiple Choice

Question image

At what time of day was it the coldest?

1

4:00 pm

2

10:00 am

3

66 degrees

4

80 degrees

5

Multiple Choice

Question image
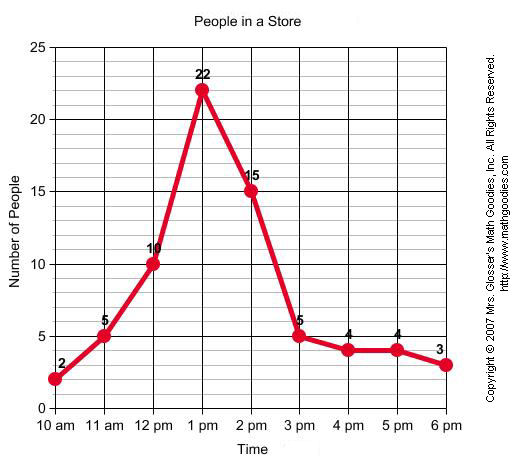
When was the greatest amount of shoppers at the store?
1
10am
2
1pm
3
6pm
4
2pm

6

Multiple Choice

Question image
Between which two times was the greatest increase in number of shoppers?
1
12pm and 1pm
2
1pm and 2pm
3
2pm and 3pm
4
10am and 11am

7

Multiple Choice

Question image
Between which two days was the greatest decrease in push-ups?
1
Friday and Saturday
2
Tuesday and Wednesday
3
Sunday and Monday
4
Thursday and Friday
pattern-tertiary
MD.2 Line Graphs

By Alicia Van Heesch

Show answer

Auto Play

Slide 1 / 7

SLIDE