Search Header Logo
7G_Graphs

7G_Graphs

Assessment

Presentation

Mathematics

7th Grade

Medium

Created by

Maman Firmansyah

Used 7+ times

FREE Resource

9 Slides • 12 Questions

1

Graphs

media

​Unit 11

2

​Learning Objectives

After studying this topic, students are able to:

• represent situations in words or as linear functions

• plot graphs of linear functions

• learn how to recognize lines parallel to the x-axis or y-axis

• interpret graphs related to rates of change

3

Multiple Choice

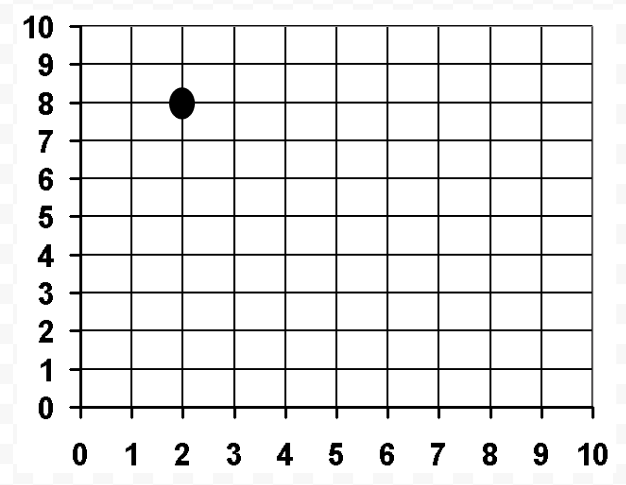
Question image

What is the coordinate of this point?

1

(8, 2)

2

(2, 7)

3

(2, 8)

4

(8, 3)

4

Multiple Choice

Given an expression 2x52x-5  

What is the value of the expression, when x=1x=1  ?

1

3

2

-3

3

16

4

-8

5

11.1 Functions

A function shows the relationship between two variables.

You often use x and y to represent two variables, but you can use other letters.

Example:

Maryam is 6 years older than his brother Jamal.

m = j + 6

So, when Jamal is 12 years old, Maryam will be:

m = 12 + 6 = 18 years old

6

Multiple Choice

Lilah's mass is 34\frac{3}{4}  of the mass of Abdul.

If Abdul's mass is 40 kg, what is the mass of Lilah?

1

30

2

40

3

50

4

60

7

Multiple Choice

The relationship between US Dollar (x) and Libyan Dinar (y) is y=1.5xy=1.5x  .

How much Libyan Dinar will you get, if you exhange US $100 ?

1

$15

2

$150

3

$1500

4

$15000

8

11.2 Graph of functions

Given a function y = x + 3.

When x = ​2, then y = 2 + 3 = 5

​When x = -4, then y = -4 + 3 = -1

​You can display values of x and the corresponding values of y in a table

media

9

11.2 Graph of functions

Given a function y = x + 3.

Q: Is the point (5,9) located on the line?

Check:

y = x + 3

when x=5, y=5+3=8,

So, the point (5,8) is on the line, but

the point (5,9) is NOT on the line.

media
media

10

Multiple Choice

Given a line with the function y=x2y=x-2  .

Which of the following points is NOT located on the line?

1

(0, -2)

2

(2, 0)

3

(3, -1)

4

(4, 2)

11

11.3 Lines parallel to the axes

A and B are on a line parallel to

​the y-axis. The line is x = 4.

​​C and D are on a line parallel to

​the y-axis. The line is x = -2.

​​

A and D are on a line parallel to

​the x-axis. The line is y = 2.

​​

B and C are on a line parallel to

​the x-axis. The line is y = -3.

media

12

Multiple Choice

Question image

What is the equation of this line?

1

x = -5

2

y = -5

3

x - y = -5

4

x + y = -5

13

Multiple Choice

Which of these is the equation of the line that passes through

(–2, 2), (5, 2) and (–1, 2)?

1

y = -2

2

x = 5

3

y = 2

4

x = -1

14

11.4 Interpreting graphs

Graphs can show how the value of variable changes with time.

Example:

This graph shows the distance

travelled by a runner in a 5 km race.

media

15

Multiple Choice

Question image

How long does the runner take to run the 5 km race?

1

5 minutes

2

10 minutes

3

15 minutes

4

20 minutes

16

Multiple Choice

Question image

How far has the runner gone after 5 minutes?

1

1 km

2

1.6 km

3

2 km

4

3 km

17

Multiple Choice

Question image

The graph shows a 10 km race run by Sachita and Anandhu.

Who ran at the same speed for 10 km?

1

Sachita

2

Anandhu

18

Multiple Choice

Question image

Which was the faster part of the journey?

1

Between 7 am and 8 am 

2

Between 8:00 am and 8:30 am

19

Multiple Choice

Question image

A plane flies from New York to Brussels.

The graph shows the distance left to travel during the flight.

How many kilometres has the plane flown after five hours?

1

2500 km 

2

3500 km

3

2000 km

4

1000 km

20

21

Graphs

media

​Unit 11

Show answer

Auto Play

Slide 1 / 21

SLIDE