Search Header Logo
8th grade unit 1 Force and Motion Graphs

8th grade unit 1 Force and Motion Graphs

Assessment

Presentation

Science

8th Grade

Medium

NGSS
MS-PS3-1, MS-ESS1-1, MS-ESS2-1

+17

Standards-aligned

Created by

Richard Thomas

Used 26+ times

FREE Resource

8 Slides • 18 Questions

1

Force and Motion Graphs

by Richard Thomas

2

Graphs of motion are crucial for physicists to determine the position and speed of an object. Unlike maps and speedometers which are useful for non-physicists, graphs provide a detailed analysis of an object's movement over time. Motion seems to be essential in our lives as well as influences so many of our activities.

3

So why are motion graphs important?

4

​A quick review before motion graphs are covered.......

5

Motion

Position is relative to an origin.
Example: "Ken is behind Barbie and Barbie is behind Ken."

Position is not the same as distance. It just describes "where"

6

Speed and Velocity

  • Speed = Distance/Time

  • When you divide the total distance of a trip by time you get the average speed

  • Distance and displacement are not the same. Distance is covered ground and displacement is moving from a place or position.

  • Instantaneous Speed is the actual speed at a given moment.

7

Graphs of Motion

Constant speed means the speed stays the same

Constant speed will look different on a position vs. time graph and a speed vs. time graph

8

Motion Graphs

9

Multiple Choice

Question image

What does the horizontal line represent in this graph?

1

Resting, not moving

2

a constant speed

3

acceleration

4

velocity

10

Multiple Choice

Acceleration occurs when an object changes its speed or ______.

1

direction

2

force

3

inertia

4

mass

11

Multiple Choice

Question image

Which runner stopped for a rest?

1

Albert

2

Bob

3

Charlie

12

Multiple Choice

Question image

Which runner won the race?

1

Albert

2

Bob

3

Charlie

13

Multiple Choice

Question image

How long did one of the runner's rest?

1

8 seconds

2

13 seconds

3

5 seconds

4

50 seconds

14

Multiple Choice

Velocity is

1

speed and acceleration

2

constant speed

3

a frame of reference

4

speed in a given direction

15

Multiple Choice

Acceleration is

1

increasing speed

2

decreasing speed

3

changing direction

4

all of the above

16

Multiple Choice

A car driving at 50 miles per hour drives for 2 hours. What distance did it cover?

1

50 miles

2

25 miles

3

100 miles

4

75 miles

17

Multiple Choice

Question image

What does this graph represent?

1

Constant speed

2

Acceleration

3

Not moving

18

Multiple Choice

Question image

What does this graph represent?

1

Constant Speed

2

Acceleration

3

Not moving

19

Multiple Choice

Question image

What does this graph represent?

1

Constant speed

2

Acceleration

3

Not moving

20

Multiple Choice

Question image

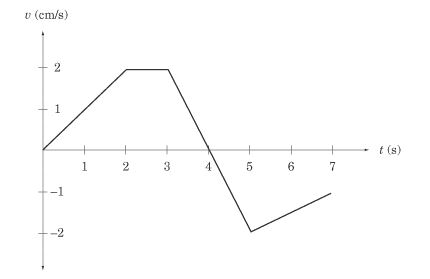
What is happening between 2 and 3 seconds?

1

The object is not moving.

2

The object is not accelerating.

3

The object is slowing down.

4

The object is speeding up.

21

Multiple Choice

Question image

What is happening between 3 seconds and 4 seconds?

1

The object is moving in a negative direction.

2

The object is returning to its starting position.

3

The object is slowing to a stop.

4

The object is changing direction.

22

Multiple Choice

Question image

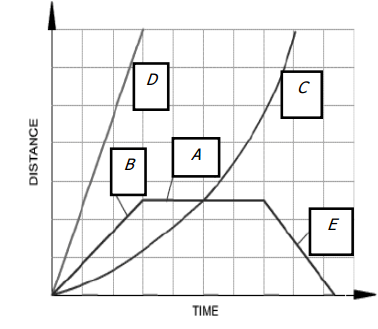
What is happening at E?

1

Stationary

2

Accelerating

3

Fast steady speed; moving away from the starting position

4

Steady speed; returning to start position

23

Multiple Choice

Question image

Which runner had a head start?

1

A

2

B

3

C

24

Multiple Choice

Question image

 Every morning, Tom walks along a straight road from his home to the bus stop. Below, is a graph representing Tom’s trip to school. - What is the distance covered through the second segment, which is between 50 seconds, and 70 seconds?

1

40 meters

2

60 meters

3

80 meters

4

20 meters

25

Multiple Choice

Question image

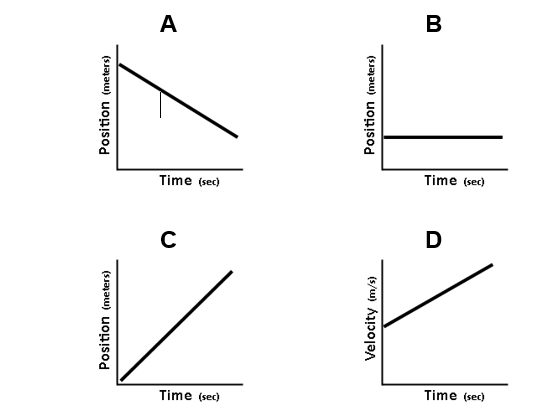
Which graph shows the object standing still?

1

A

2

B

3

C

4

D

26

Multiple Choice

Question image

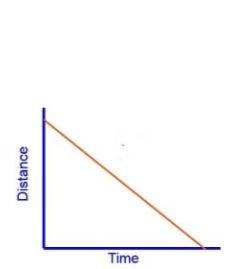
What is this line of this graph showing?

1

moving away from starting point at a constant speed

2

moving back towards the starting point at a constant speed

3

acceleration (getting faster)

4

deceleration (getting slower)

Force and Motion Graphs

by Richard Thomas

Show answer

Auto Play

Slide 1 / 26

SLIDE