

Grade 9 - Thinking Geographically W2L1

Presentation
•
Geography
•
9th Grade
•
Practice Problem
•
Easy

Liz Anderson
Used 2+ times
FREE Resource
15 Slides • 12 Questions
1
Different Types of Maps
2
By the end of this lesson you will:
be able to identify different types of maps
understand spatial patterns represented on maps
understand all maps are selective in information

3
The main purpose of a reference map is to show locations of many types of features (e.g. cities in relation to highways and rivers or campgrounds in relation to parks and highways).
Reference maps often use conventional colors and symbols to represent a great variety of topics.

4
Multiple Choice
A reference map is used to show locations of different features on a map.
TRUE OR FALSE?
True
False
5
Multiple Choice
Reference Maps only use one colour at a time to represent the information you are looking for.
TRUE OR FALSE?
False
True
6
This is also called a 'Special Purpose Map'.
Unlike a reference map, a thematic map usually presents only one topic
The map on this page is a map of Europe, but only represents the forest areas in Europe.

7
Multiple Choice
What makes a Thematic Map different from a Reference Map?
A thematic map only represents one colour
A thematic map has many topics
A thematic maps only represents one topic
A reference map has many topics
8
Multiple Choice
A thematic map can show you where different points of interest are on a map. For example, schools, malls and petrol stations.
TRUE OR FALSE?
True
False
9
Thematic maps tell you the purpose in their title.


10

11
Poll
A thematic map has what represented on it?
One topic in different shades
Lots of different topics
I don't know
12
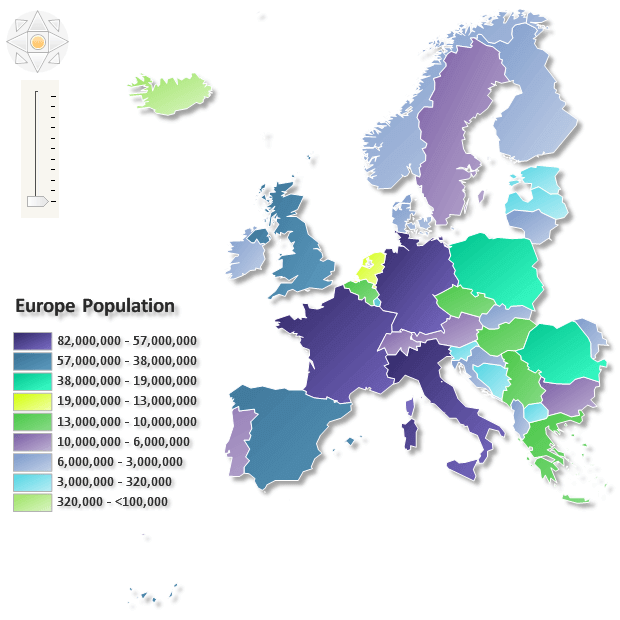
A choropleth map is a thematic map in which your area of research (ie population) are colored or shaded according to the range in which the statistic of interest falls.
13
A choropleth map is a kind of thematic map in which the colours or shades are not random like in the images on the previous slides but have a chromatic sequence that is proportional to what it is that you are researching on your map.
For example, from dark to light colours or from dense shading to light shading.
See the image on the next slide as an example.
14

15
You can tell that this is a choropleth map as the colours are a graduating scale from brown to pink.
The colours are not a range of different colours - that would make it more of a thematic map.

16
Multiple Choice
A choropleth map is a type of what other map?
Reference map
Thematic map
Street map
Google map
17
Multiple Choice
What makes a choropleth map easy to identify?
It is a map of only one topic
It has various different colours on it
It has only one topic and shades of one colour
It is not a reference map
18
Multiple Choice

What type of map is this?
Reference Map
Choropleth Map
Thematic Map
19
¨Shows the values of one or more numeric data fields. Each dot on a dot-density map represents some amount of data.

20
Multiple Choice
What does a 'dot' represent on a dot map?
I don't know
Topics
Colours
Small amounts of data
21
This map represents how many people have been killed by a lightning strike in the US between 2007 and 2017.
You can see by the scale how many people the dots represent.

22
Multiple Choice

What sort of map is this?
Reference
Choropleth
Dot
Thematic
23
Isoline maps help the reader to recognize patterns and relationships between the geography of an area and data that might have been collected, such as air temperature.

24
Multiple Choice

This isoline map image is a representation of what type of geography?
Physical
Human
25
Cartogram is a map in which the geometry of regions is distorted in order to convey the information you are looking for. The area on the map will be inflated (bigger) or deflated (smaller) according to its numeric value.
Look at the image on the next page of a 'world population cartogram' and in particular look at how big India is. This is because it has a big population.
26

27
Multiple Choice
A cartogram map looks strange because:
there are very few points of reference
the we are not used to looking at them
the country size is bigger or smaller depending on the data you are looking at
the colours chosen always clash with each other
Different Types of Maps
Show answer
Auto Play
Slide 1 / 27
SLIDE
Similar Resources on Wayground

23 questions
Structure of the Earth
Presentation
•
9th Grade
20 questions
Los continentes
Presentation
•
8th Grade
22 questions
Parallel and Perpendicular Lines
Presentation
•
9th Grade
20 questions
Sustainability Lesson with Videos
Presentation
•
9th Grade
20 questions
respiratory system bio lesson
Presentation
•
9th Grade
20 questions
Advertisement
Presentation
•
9th Grade
20 questions
GOOGLE APPS
Presentation
•
9th Grade
20 questions
Lesson 1 Review :Introductions/Greetings
Presentation
•
9th Grade
Popular Resources on Wayground
10 questions
Safety Day 2026 – Student Review

Quiz
•
9th Grade
21 questions
Continents and Oceans
Quiz
•
6th Grade
20 questions
Parts of Speech
Quiz
•
5th Grade
16 questions
Subject & Predicate
Quiz
•
5th Grade
25 questions
Multiplication Facts
Quiz
•
5th Grade
12 questions
Map Skills
Quiz
•
3rd Grade
22 questions
Continents and Oceans
Quiz
•
5th Grade
15 questions
Rounding Decimals
Quiz
•
5th Grade
Discover more resources for Geography
13 questions
5 Themes of Geography
Presentation
•
9th - 12th Grade
25 questions
Unit 4 Exam Review
Quiz
•
9th Grade
10 questions
Reteach Unit 4: Latin America Review
Presentation
•
9th - 10th Grade
42 questions
AP Human Geography Unit 2
Quiz
•
9th Grade
20 questions
US & Canada Physical and Political Geography
Quiz
•
9th - 12th Grade
7 questions
Prairie, Pacific, and Territories
Presentation
•
9th - 12th Grade
8 questions
The Fight Against Terrorism
Presentation
•
9th - 12th Grade
45 questions
WG North America Test Review
Quiz
•
9th Grade