
- Resource Library
- Math
- Percents, Ratios, And Rates
- Proportional Relationships
- Unit 3: Lesson 2 : Graphs Of Proportional Relationships
Unit 3: Lesson 2 : Graphs of Proportional Relationships
Presentation
•
Mathematics
•
8th Grade
•
Practice Problem
•
Easy
Standards-aligned
Ja'naisa Harris
Used 13+ times
FREE Resource
13 Slides • 2 Questions
1
Unit 3: Lesson 2 : Graphs of Proportional Relationships
2
I Can Learning Goals
I can graph a proportional relationship from an equation.
I can tell when two graphs are of the same proportional relationship even if the scales are different.
3
Open Ended
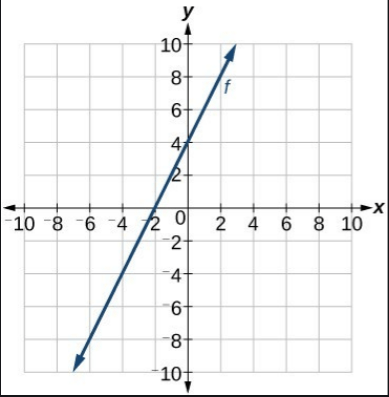
Warm-Up: Write an equation for this graph.
4
Possible Responses
y= 143x
y= 1.75x
y=47x
5
Task 1: Card Sort
I will give you 12 proportional relationship graphs.
Write the equation for each graph. Some graphs may have the same equation. You can group the ones that will have the same equation.
6
7
8
Possible Responses
A; y= 0.25x
B,E,H; y=3x
C,D,G,K; y=3.5x
I,L; y=34x
F,J; y=25x
9
Task 2
Two large water tanks are filling with water. Tank A is not filled at a constant rate, and the relationship between its volume of water and time is graphed on each set of axes. Tank B is filled at a constant rate of 1/2 liters per minute. The relationship between its volume of water and time can be described by the equation v=21t , where t is the time in minutes and v is the total volume in liters of water in the tank.
10
Graph 1
11
Graph 2
12
Task 2 Questions
Answer the following questions and say which graph you used to find your answer.
Q1: After 30 seconds, which tank has the most water?
Q2: At approximately what times do both tanks have the same amount of water?
Q3: At approximately what times do both tanks contain 1 liter of water? 20 liters? At approximately what times do both tanks contain 1 liter of water? 20 liters?
13
Possible Responses
A1: Using the first graph, Tank A has more water after 30 seconds.
A2: Using the second graph, at approximately 64 minutes both tanks have the same amount of water.
A3: Using the first graph, Tank A has a liter of water after 1 minute. Tank B has a liter of water after 2 minutes. Using the second graph, Tank A has 20 liters of water at around 36 minutes while Tank B has 20 liters of water at 40 minutes. Using the first graph, Tank A has a liter of water after 1 minute. Tank B has a liter of water after 2 minutes. Using the second graph, Tank A has 20 liters of water at around 36 minutes while Tank B has 20 liters of water at 40 minutes.
14
Poll
Cool Down: Which one of these relationships is different than the other three?
Graph A
Graph B
Graph C
Graph D
15
Possible Responses
Graphs A, C, and D are all representations of y= 5x. Graph B is a representation of y= 5.5x.
Unit 3: Lesson 2 : Graphs of Proportional Relationships
Show answer
Auto Play
Slide 1 / 15
SLIDE

Similar Resources on Wayground
9 questions
Volume- Sphere, Cone, Cylinder
Presentation
•
8th Grade
11 questions
Direct Variation
Presentation
•
8th Grade
12 questions
Slope Lesson
Presentation
•
8th - 9th Grade
13 questions
what is slope
Presentation
•
8th Grade
9 questions
Percent of Change
Presentation
•
8th Grade
11 questions
Analyzing Graphs
Presentation
•
8th Grade
11 questions
Dialation
Presentation
•
8th Grade
12 questions
Graphing/Functions
Presentation
•
8th Grade
Popular Resources on Wayground
24 questions
PBIS-HGMS Day 10
Quiz
•
6th - 8th Grade
10 questions
HCS SCI 03 Summer School Review 3
Quiz
•
3rd Grade
11 questions
Home Scope
Quiz
•
7th - 8th Grade
15 questions
HCS SCI 05 Summer School Assessment 3 Review
Quiz
•
5th Grade
35 questions
Lufkin Road Middle School Student Handbook & Policies Assessment
Quiz
•
7th Grade
18 questions
Geo 11.3 Area of Circles and Sectors
Quiz
•
9th - 11th Grade