
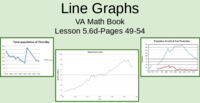
Line Graphs- Lesson 5.6d

Flashcard
•
Mathematics
•
4th Grade
•
Practice Problem
•
Hard

Wayground Content
FREE Resource
Student preview

15 questions
Show all answers
1.
FLASHCARD QUESTION
Front
What is a line graph?
Back
A line graph is a type of chart that shows information as a series of data points called 'markers' connected by straight line segments. It is used to display data that changes over time.
2.
FLASHCARD QUESTION
Front
What does the x-axis represent in a line graph?
Back
The x-axis (horizontal axis) typically represents the independent variable, which is the variable that is changed or controlled in an experiment.
3.
FLASHCARD QUESTION
Front
What does the y-axis represent in a line graph?
Back
The y-axis (vertical axis) usually represents the dependent variable, which is the variable that is measured or affected in an experiment.
4.
FLASHCARD QUESTION
Front
How do you read a line graph?
Back
To read a line graph, look at the x-axis to find the value of the independent variable, then move up or down to find the corresponding value on the y-axis.
5.
FLASHCARD QUESTION
Front
What does an upward slope on a line graph indicate?
Back
An upward slope indicates that as the independent variable increases, the dependent variable also increases.
6.
FLASHCARD QUESTION
Front
What does a downward slope on a line graph indicate?
Back
A downward slope indicates that as the independent variable increases, the dependent variable decreases.
7.
FLASHCARD QUESTION
Front
What is the purpose of a title in a line graph?
Back
The title of a line graph explains what the graph is about, providing context for the data being presented.
Access all questions and much more by creating a free account
Create resources
Host any resource
Get auto-graded reports

Continue with Google

Continue with Email

Continue with Microsoft
or continue with

%20(1).png)
Apple

Others
By signing up, you agree to our Terms of Service & Privacy Policy
Already have an account?

