
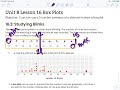
Understanding Boxplots and Data Distribution

Interactive Video
•
Mathematics
•
6th - 8th Grade
•
Practice Problem
•
Hard

Thomas White
FREE Resource
Read more
10 questions
Show all answers
1.
MULTIPLE CHOICE QUESTION
30 sec • 1 pt
What is the main objective of the lesson on boxplots?
To understand how to use a five-number summary to draw a boxplot
To learn how to calculate the mean of a data set
To explore different types of graphs
To study the history of boxplots
2.
MULTIPLE CHOICE QUESTION
30 sec • 1 pt
What was the data set used in the study about?
The number of times people blinked while watching a video game
The number of times people smiled during a movie
The number of times people yawned during a lecture
The number of times people laughed during a comedy show
3.
MULTIPLE CHOICE QUESTION
30 sec • 1 pt
What is the median value in the given data set?
12
15
51
21
4.
MULTIPLE CHOICE QUESTION
30 sec • 1 pt
Which value represents the first quartile (Q1) in the data set?
3
12
15
21
5.
MULTIPLE CHOICE QUESTION
30 sec • 1 pt
What is the maximum value in the data set?
51
12
21
3
6.
MULTIPLE CHOICE QUESTION
30 sec • 1 pt
What does the interquartile range (IQR) represent in a boxplot?
The range of the entire data set
The middle 50% of the data
The average of the data set
The sum of all data points
7.
MULTIPLE CHOICE QUESTION
30 sec • 1 pt
What is the purpose of the 'whiskers' in a boxplot?
To show the mean of the data
To indicate the range of the middle 50% of the data
To represent the minimum and maximum values
To display the mode of the data
Access all questions and much more by creating a free account
Create resources
Host any resource
Get auto-graded reports

Continue with Google

Continue with Email

Continue with Microsoft
or continue with

%20(1).png)
Apple

Others
Already have an account?

