
Data Displays Review
Authored by Anthony Clark
Mathematics
7th Grade
CCSS covered
Used 1+ times


AI Actions
Add similar questions
Adjust reading levels
Convert to real-world scenario
Translate activity
More...
Content View
Student View
10 questions
Show all answers
1.
MULTIPLE CHOICE QUESTION
1 min • 1 pt
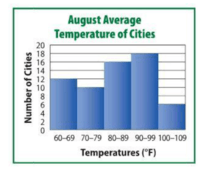
How many cities have temperatures between 70 degrees and 99 degrees?
44
34
26
62
2.
MULTIPLE CHOICE QUESTION
1 min • 1 pt
Is a histogram the same as a bar graph?
Yes, because they both use intervals.
No, because a histogram displays numerical data while a bar graph displays categorical data.
Yes, because they both use bars to display data.
No, because a histogram displays categorical data while a bar graph displays numerical data.
3.
MULTIPLE CHOICE QUESTION
1 min • 1 pt
The vertical axis of a line graph is called the __________.
slope
line of best fit
x-axis
y-axis
Tags
CCSS.5.G.A.1
4.
MULTIPLE CHOICE QUESTION
1 min • 1 pt
Which of the following statements corresponds to a frequency distribution?
a table that shows the number of times a data entry appears in a data set.
a data set that shows the number of data entries that appear in a time.
a conclusion drawn from a sample.
the boundaries between two consecutive bars.
5.
MULTIPLE CHOICE QUESTION
1 min • 1 pt

How many classes are there?
6
30
1-5
1-30
6.
MULTIPLE CHOICE QUESTION
1 min • 1 pt

What is the midpoint of the first class?
4
5
1
3
7.
MULTIPLE CHOICE QUESTION
1 min • 1 pt

What is the relative frequency of the first class?
0.139 or 13.9%
0.5 or 5%
1-5
5


Access all questions and much more by creating a free account
Create resources
Host any resource
Get auto-graded reports

Continue with Google

Continue with Email

Continue with Microsoft
or continue with

%20(1).png)
Apple

Others
By signing up, you agree to our Terms of Service & Privacy Policy
Already have an account?

