
AP Stats Comparing Box Plots
Authored by Barbara White
Mathematics
8th - 9th Grade
Used 8+ times


AI Actions
Add similar questions
Adjust reading levels
Convert to real-world scenario
Translate activity
More...
Content View
Student View
14 questions
Show all answers
1.
MULTIPLE CHOICE QUESTION
3 mins • 1 pt
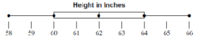
What is the minimum value?
2.
MULTIPLE CHOICE QUESTION
3 mins • 1 pt

What is the maximum value?
3.
MULTIPLE CHOICE QUESTION
15 mins • 1 pt
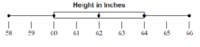
What value is the lower quartile (Q1)?
66
58
60
64
4.
MULTIPLE CHOICE QUESTION
3 mins • 1 pt
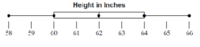
What data value is the upper quartile (Q3)?
5.
MULTIPLE CHOICE QUESTION
15 mins • 1 pt
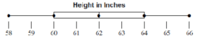
What is the interquartile range (IQR)?
6.
MULTIPLE CHOICE QUESTION
5 mins • 1 pt

The box plots compare the number of points two basketball players scored per game over 20 games last season. Which statement is supported by the information in the box plots?
Player A has a larger spread of points than Player B
Player A has a larger median than Player B
The interquartile range for Player A is the same as Player B's.
The third quartile is larger for Player A than Play B.
7.
MULTIPLE CHOICE QUESTION
3 mins • 1 pt

The box plots compare the heights of the girls and the boys in the seventh grade at Heizor Middle School. Which statement is true based on the information in the box plots above?
The boy's heights have a median about 10 inches larger than the girl's heights.
The boy's heights have a larger spread than the girls' heights
At least one boy and one girl are 72 inches tall.
The first quartile is larger for the boy's height than the girl's height.


Access all questions and much more by creating a free account
Create resources
Host any resource
Get auto-graded reports

Continue with Google

Continue with Email

Continue with Microsoft
or continue with

%20(1).png)
Apple

Others
By signing up, you agree to our Terms of Service & Privacy Policy
Already have an account?

