
Analyzing Two Variable Data
Authored by Barbara White
Mathematics
9th - 12th Grade
CCSS covered
Used 2+ times


AI Actions
Add similar questions
Adjust reading levels
Convert to real-world scenario
Translate activity
More...
Content View
Student View
17 questions
Show all answers
1.
MULTIPLE CHOICE QUESTION
5 mins • 1 pt
What is a line of best fit used for?
Tags
CCSS.8.EE.B.5
2.
MULTIPLE CHOICE QUESTION
5 mins • 1 pt
What term represents the measure how strong or weak the relationship between 2 quantitative variables are.
Scatter Plot
Causation
Correlation
Line of best fit
3.
MULTIPLE CHOICE QUESTION
5 mins • 1 pt

Describe the correlation of the data shown in the graph
Negative correlation
No correlation
Positive correlation
Constant correlation
4.
MULTIPLE CHOICE QUESTION
5 mins • 1 pt

What type of correlation does this graph have?
Strong Positive correlation
Strong Negative correlation
No correlation
Weak positive correlation
5.
MULTIPLE CHOICE QUESTION
5 mins • 1 pt
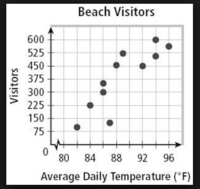
Which sentence describes the relationship shown on this scatter plot?
6.
MULTIPLE CHOICE QUESTION
5 mins • 1 pt

If Gold's Gym paid $250 for each TV, how many did they buy?
35
30
45
20
Tags
CCSS.HSF.IF.A.2
7.
MULTIPLE CHOICE QUESTION
5 mins • 1 pt
What does the value, r= -0.89, tell us about the linear relationship of two quantitative variables?
Strong positive
Weak positive
Strong negative
Weak negative
Tags
CCSS.HSF-LE.A.1B


Access all questions and much more by creating a free account
Create resources
Host any resource
Get auto-graded reports

Continue with Google

Continue with Email

Continue with Microsoft
or continue with

%20(1).png)
Apple

Others
Already have an account?

