
Extra Statistics Practice for the SAT
Authored by Nitin R
Mathematics
11th Grade


AI Actions
Add similar questions
Adjust reading levels
Convert to real-world scenario
Translate activity
More...
Content View
Student View
160 questions
Show all answers
1.
MULTIPLE CHOICE QUESTION
5 mins • 5 pts
The normal curve is symmetrical about the mean.
2.
MULTIPLE CHOICE QUESTION
45 sec • 1 pt

This data is normally distributed. What percent of the data is in the shaded region?
50%
68%
95%
99.7%
3.
MULTIPLE CHOICE QUESTION
5 mins • 5 pts

This data is normally distributed. What percent of the data is in the shaded regions?
5%
95%
2.5%
50%
4.
MULTIPLE CHOICE QUESTION
5 mins • 5 pts

This data is normally distributed. What percent of the data is in the shaded region?
68%
32%
16%
50%
5.
MULTIPLE CHOICE QUESTION
2 mins • 1 pt

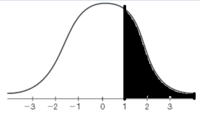
This data is normally distributed. What percent of the data is in the shaded region?
6.
MULTIPLE CHOICE QUESTION
1 min • 1 pt
If I tell you that you scored at the 55th percentile on your final exam, you would know:
55% of the class scored the same or worse than you did
You earned a 55% on the exam
You failed the exam
45% of the class scored worse than you did
7.
MULTIPLE CHOICE QUESTION
1 min • 5 pts
What percentage of data falls within 1 standard deviation?
25%
68%
95%
99.7%
Access all questions and much more by creating a free account
Create resources
Host any resource
Get auto-graded reports

Continue with Google

Continue with Email

Continue with Microsoft
or continue with

%20(1).png)
Apple

Others
By signing up, you agree to our Terms of Service & Privacy Policy
Already have an account?

