
Phase Change and Heating Curve Diagrams 2021
Authored by Kelly Harrison
Physics
8th - 10th Grade
NGSS covered
Used 23+ times


AI Actions
Add similar questions
Adjust reading levels
Convert to real-world scenario
Translate activity
More...
Content View
Student View
14 questions
Show all answers
1.
MULTIPLE CHOICE QUESTION
2 mins • 1 pt

Between which points is the temperature of the substance increasing?
Tags
NGSS.MS-PS1-4
NGSS.MS-PS3-4
2.
MULTIPLE CHOICE QUESTION
2 mins • 1 pt

Between which points is the substance changing state?
Tags
NGSS.MS-PS1-4
NGSS.MS-PS3-4
3.
MULTIPLE CHOICE QUESTION
2 mins • 1 pt
Melting and freezing occur at the same temperature! True or false
True
False
Tags
NGSS.MS-PS1-4
NGSS.MS-PS3-4
4.
MULTIPLE CHOICE QUESTION
2 mins • 1 pt

A substance's heating curve is shown in the graph. What is its boiling point?
Tags
NGSS.MS-PS1-4
5.
MULTIPLE CHOICE QUESTION
2 mins • 1 pt

What state(s) of matter are present at D-E?
Tags
NGSS.MS-PS1-4
NGSS.MS-PS3-4
6.
MULTIPLE CHOICE QUESTION
2 mins • 1 pt
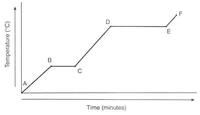
What line segment represents only the solid state?
Tags
NGSS.MS-PS1-4
NGSS.MS-PS3-4
7.
MULTIPLE CHOICE QUESTION
2 mins • 1 pt

The melting point of the sample is
-60 ºC
-100 ºC
60 ºC
100 ºC
Tags
NGSS.MS-PS1-4

Access all questions and much more by creating a free account
Create resources
Host any resource
Get auto-graded reports

Continue with Google

Continue with Email

Continue with Microsoft
or continue with

%20(1).png)
Apple

Others
Already have an account?

