Search Header Logo
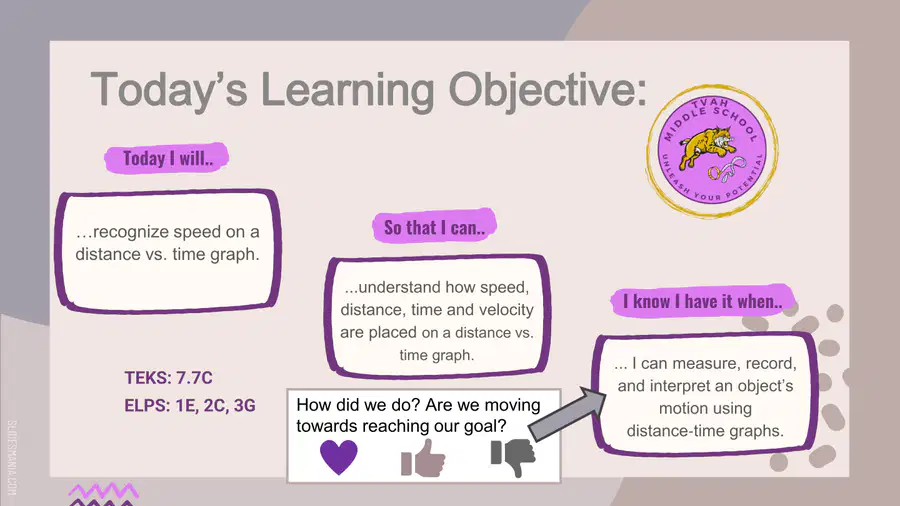
Practice Measuring, Interpreting, and Drawing Motion Time Graphs

Practice Measuring, Interpreting, and Drawing Motion Time Graphs

Assessment

Presentation

Science

7th Grade

Practice Problem

Hard

NGSS
MS-PS3-1, MS-PS2-1, MS-PS2-2

Standards-aligned

Created by

Holly Witte

Used 2+ times

FREE Resource

21 Slides • 11 Questions

1

media

2

media

3

Multiple Choice

Question image

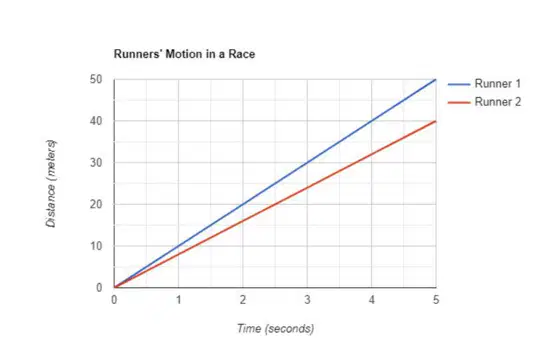
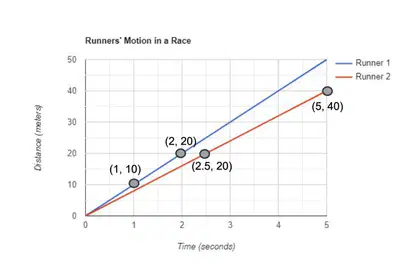
What can you interpret from this graph?

1

Runner 2 won the race

2

Runner 1 ran at a faster average speed than runner 2

3

Runner 2 probably didn’t finish the race

4

Runner 2 took the same amount of time to finish the race

4

media

5

media

6

media

7

Multiple Choice

Question image
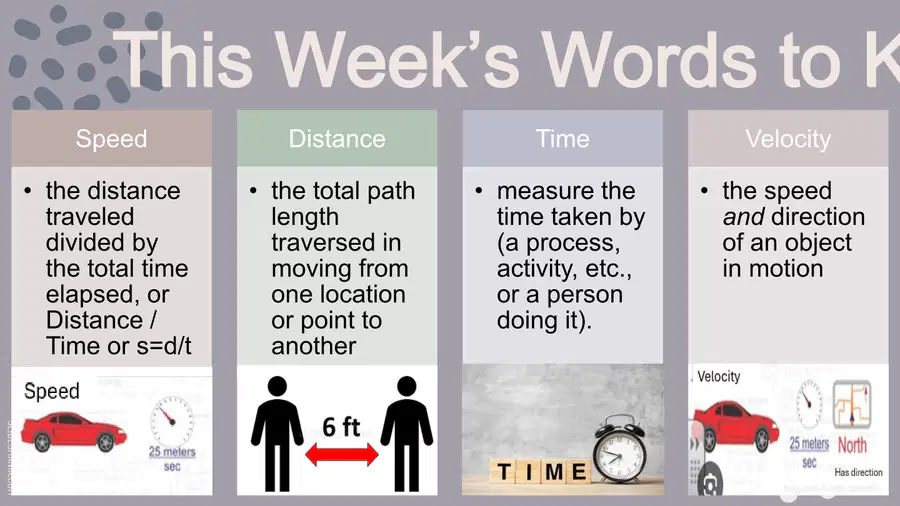
How is velocity different than speed?
1
Speed opposes velocity
2

Velocity is speed with a direction

3

Speed and velocity are the same

8

media

9

media

10

media

11

Let's measure runner 1's speed
1. select two points on Line 1
2. divide the distance (y) by Time (x)
3. both sums should match if the line shows constant speed
4. repeate for Line 2

AVERAGE SPEED FOR LINE 1: _______

​AVERAGE SPEED FOR LINE 2: _______

Measuring Distant Time Graphs

media

12

Multiple Choice

Question image

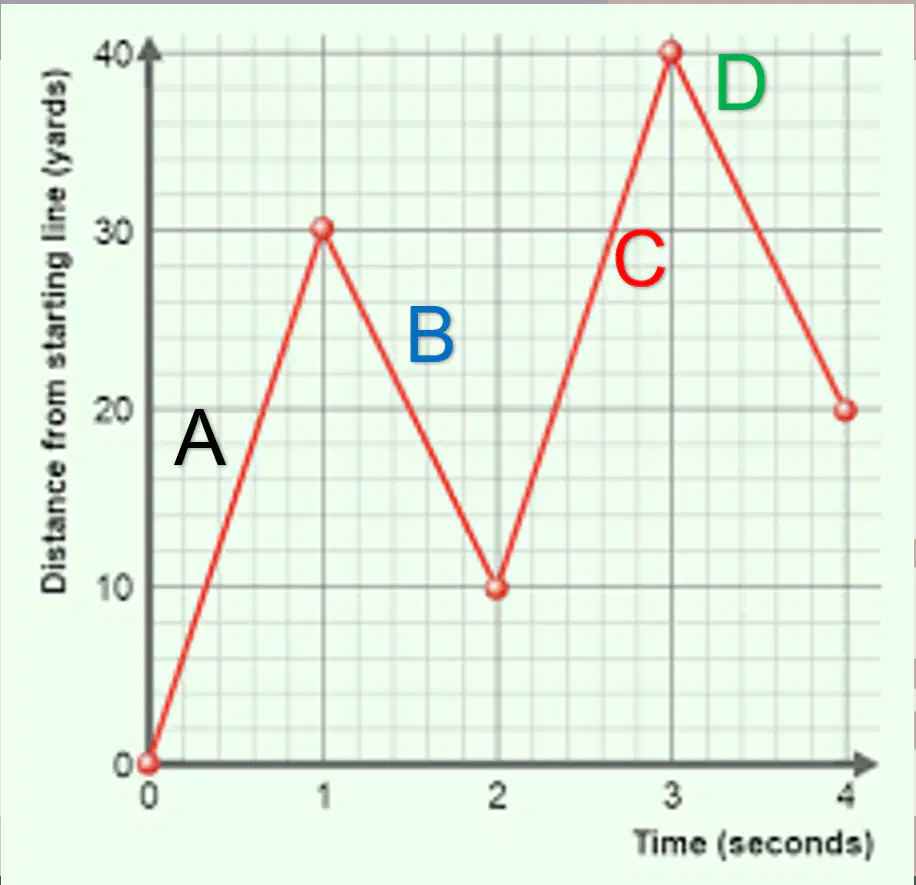
Which section shows the object moving at the fastest average speed?

1
A
2

B

3

C

4

D

13

Fill in the Blanks

media image

14

Multiple Choice

Question image

What is a plausible story for this graph?

1

A student was jogging from school to home. She stopped to tie her shoe and take a drink from her water bottle, then continued at the same pace as before.

2

A student was jogging from school to home. She walked for a while, then continued jogging.

3

A sled rider was going down a hill. The hill was steep at first, then kind of flat. At the end, it was steep again.

4

A car was slowing down, then contued moving at a constant rate. Finally, it slowed to a stop,

15

Multiple Choice

Question image

Find the average speed represented on this graph. (Hint: total distance divided by total time)

1

6 km/min

2

0.12 km/min

3

10 km/h

4

0.1 km/min

16

Fill in the Blanks

media image

Type answer...

17

media

18

Drag and Drop

Question image
CALCUTATE THE SPEEDS OF EACH BALL:

Ball A:​


Ball B:​


Ball C:​
Drag these tiles and drop them in the correct blank above
3 m/s
1 m/s
.33 m/s
2 m/s
5 m/s

19

media

20

Fill in the Blanks

media image

21

Draw

Draw the following scenarios:

  1. Blaine arrived at the trail and ran 10 m in 20 sec

  2. He rested for 20 seconds

  3. Then ran 30 meters in 20 seconds

  4. He turned around and arrived back to the trail start in 20 more seconds

22

media

23

media

24

media

25

media

26

media

27

Poll

How Confident Are You About the Measuring, Interpreting, and drawing Motion Time Graphs?

28

media

29

media

30

media

31

media

32

media
media

Show answer

Auto Play

Slide 1 / 32

SLIDE