

Untitled Presentation

Presentation
•
Mathematics
•
2nd Grade
•
Practice Problem
•
Medium

Ariel Guianan
Used 7+ times
FREE Resource
38 Slides • 27 Questions
1

2
3
Open Ended
How do measures of position such as quartiles, deciles, and percentiles help us understand data distributions?
4
Multiple Choice
Which of the following best describes the significance of measures of position in statistics?
They help in organizing data into tables.
They allow us to compare individual data points to the entire data set.
They are used only for calculating averages.
They are only useful for small data sets.
5
6
7
Open Ended
How will you interpret the interquartile range?
8
Open Ended
Is it possible that the quartiles of a set of data are equal? How do you say so?
9
10
11
Multiple Choice
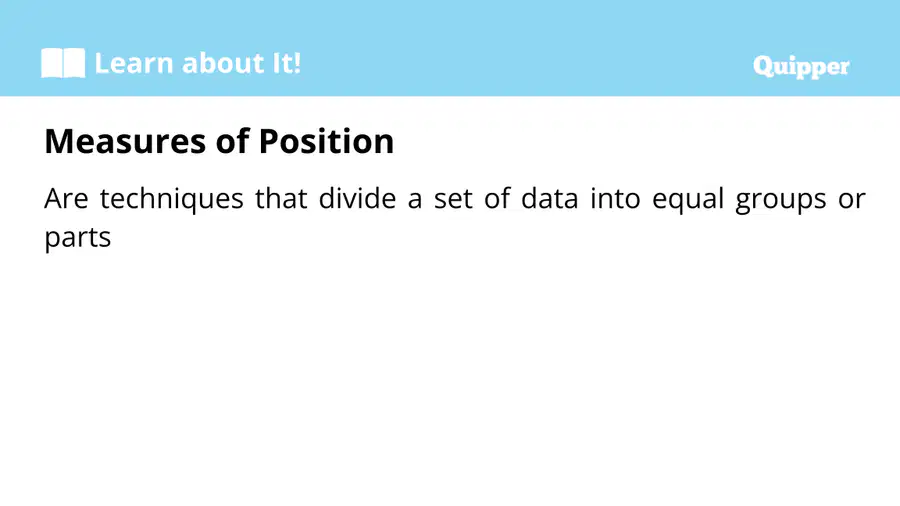
What are the three common measures of position used to divide a set of data into equal groups?
Quartiles, Deciles, Percentiles
Mean, Median, Mode
Range, Variance, Standard Deviation
Quartiles, Medians, Modes
12
13
Multiple Choice
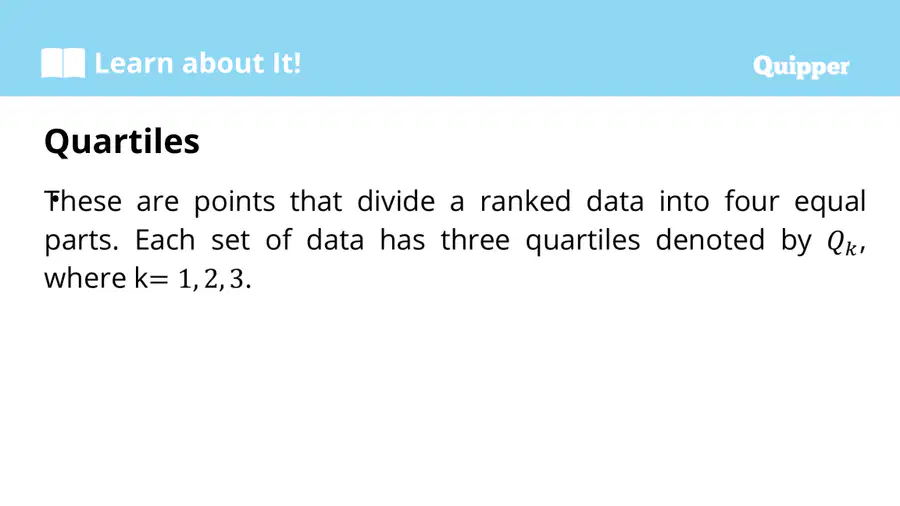
Which of the following statements about quartiles is correct?
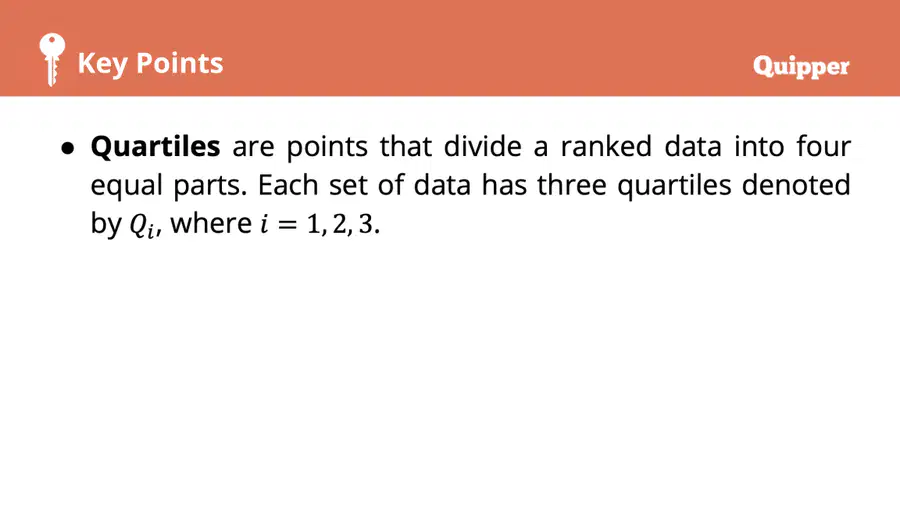
Quartiles divide a ranked data into four equal parts.
Quartiles divide a ranked data into three equal parts.
Quartiles divide a ranked data into ten equal parts.
Quartiles divide a ranked data into two equal parts.
14
15
Fill in the Blanks
Type answer...
16
17
Multiple Choice
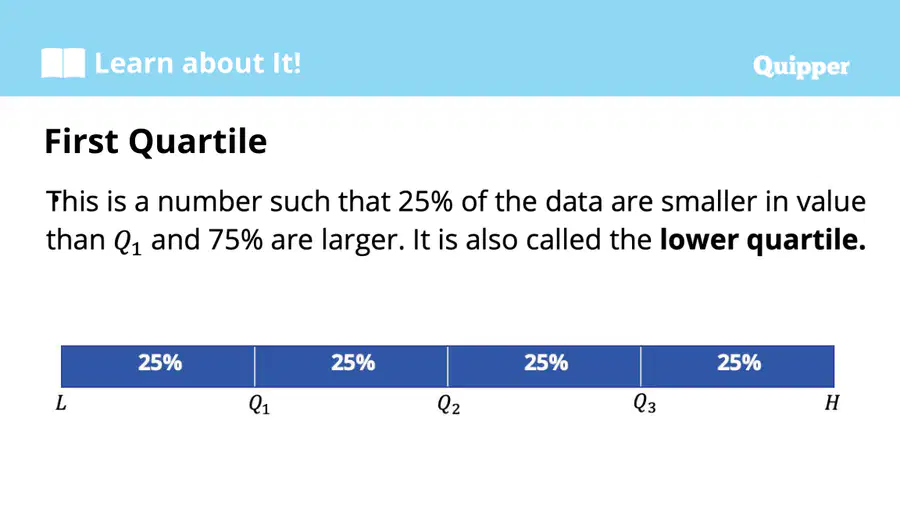
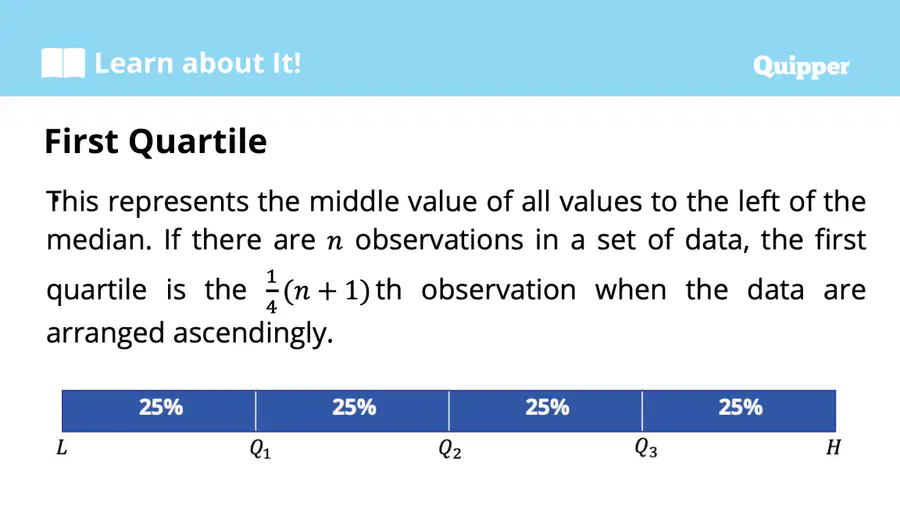
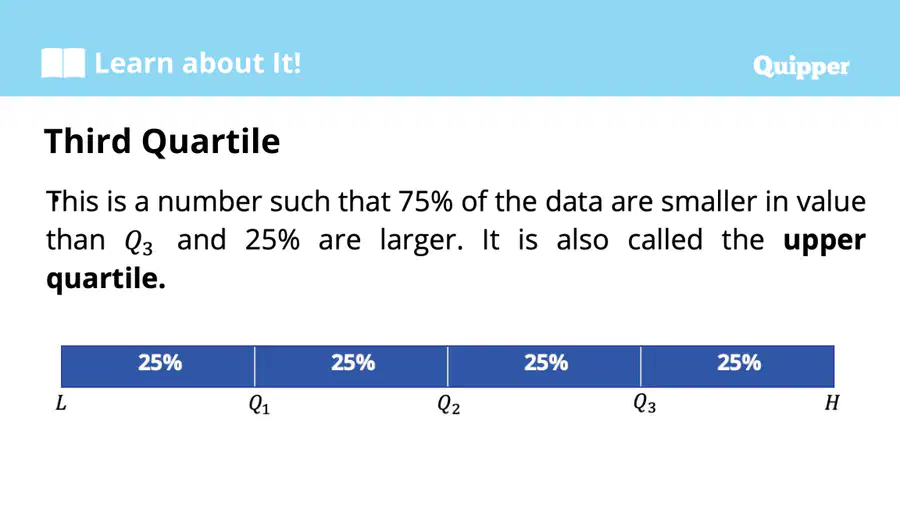
Which quartile represents the middle value of all values to the left of the median in a data set?
First Quartile
Second Quartile
Third Quartile
Upper Quartile
18
19
Multiple Select
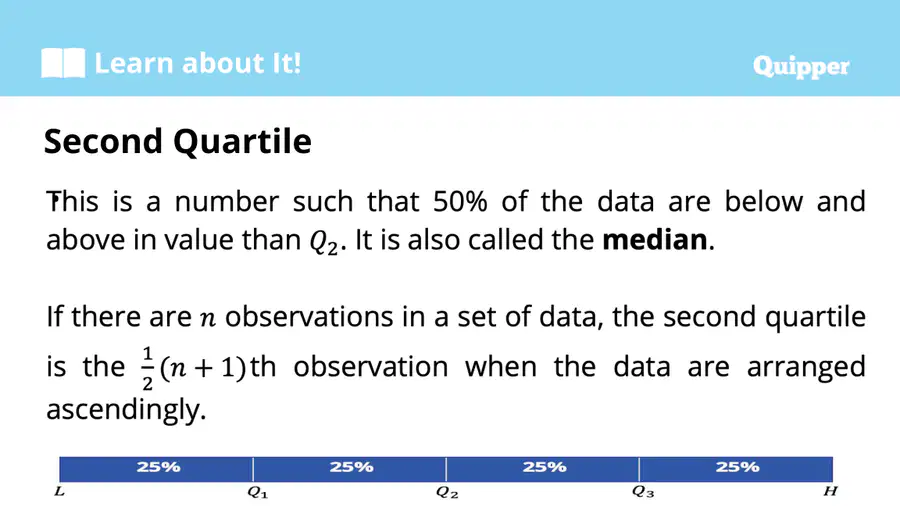
Select all statements that correctly describe the second quartile (Q2).
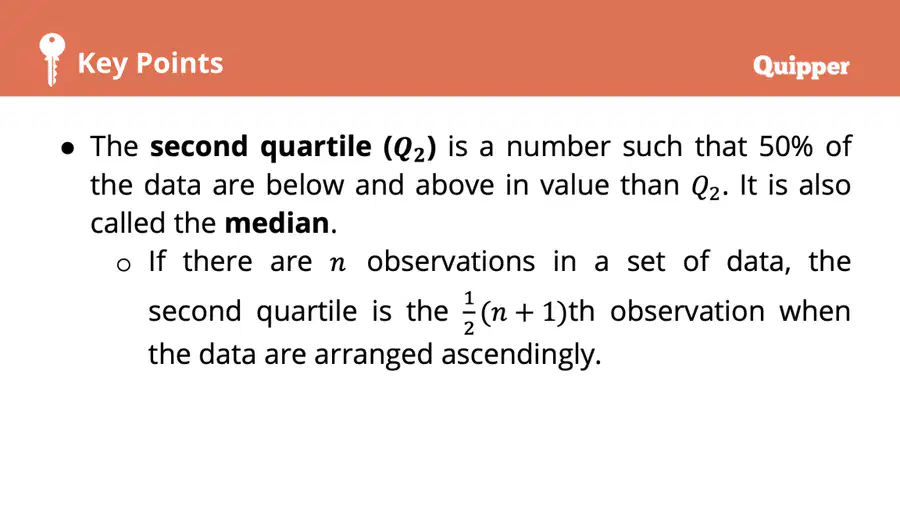
It is also called the median.
It divides the data so that 50% are below and 50% are above.
It is the 1/2(n+1)th observation in ascending order.
It is the lowest value in the data set.
20
21
Fill in the Blanks
Type answer...
22
23
Multiple Choice
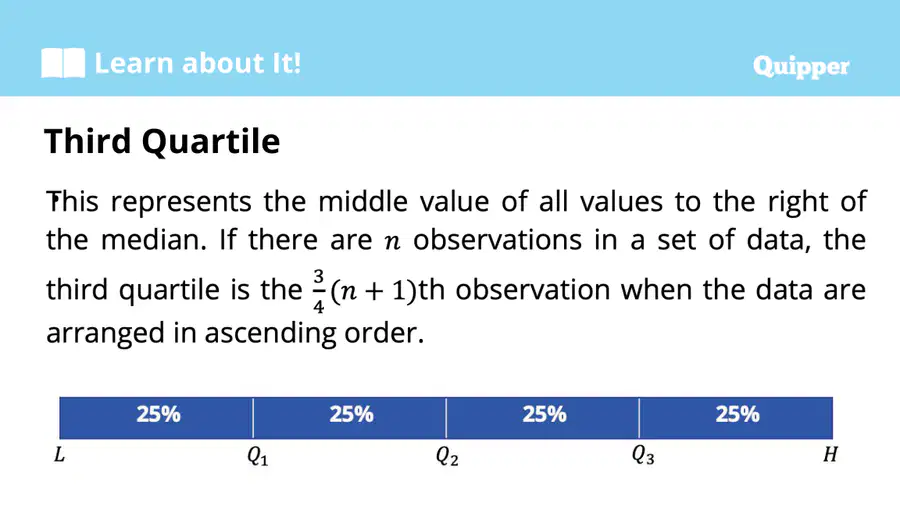
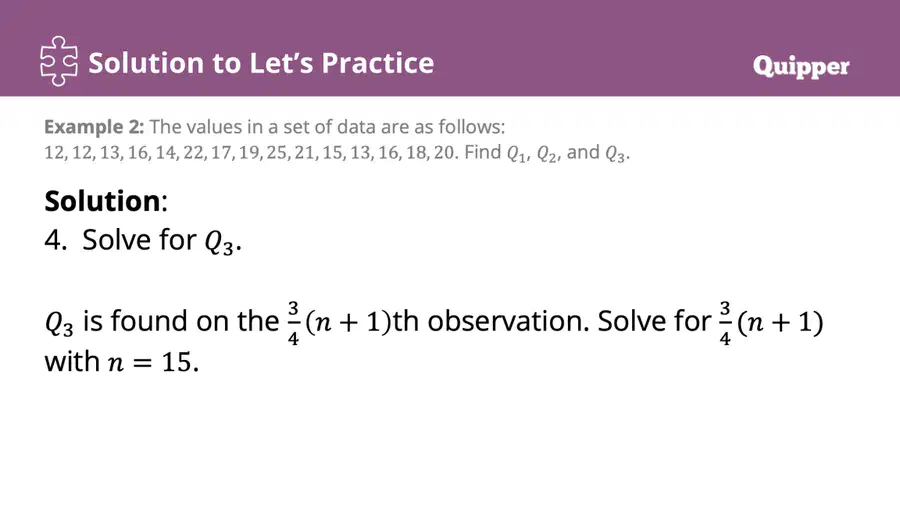
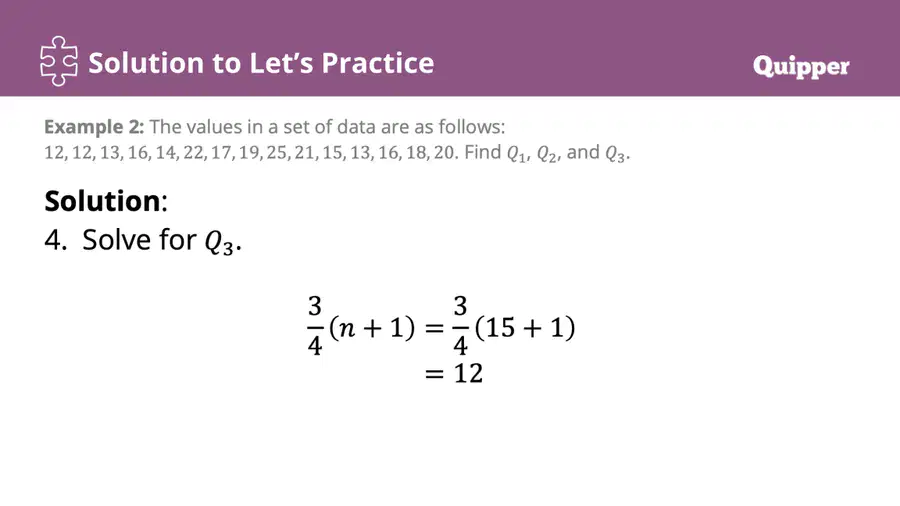
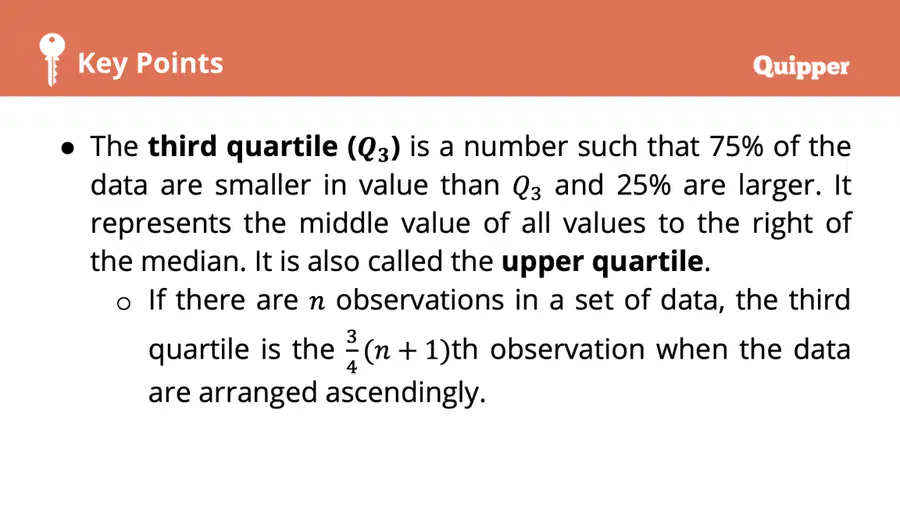
What is the formula for finding the position of the third quartile in a data set with n observations?
3/4(n+1)th observation
1/4(n+1)th observation
1/2(n+1)th observation
n/4th observation
24
25
Open Ended
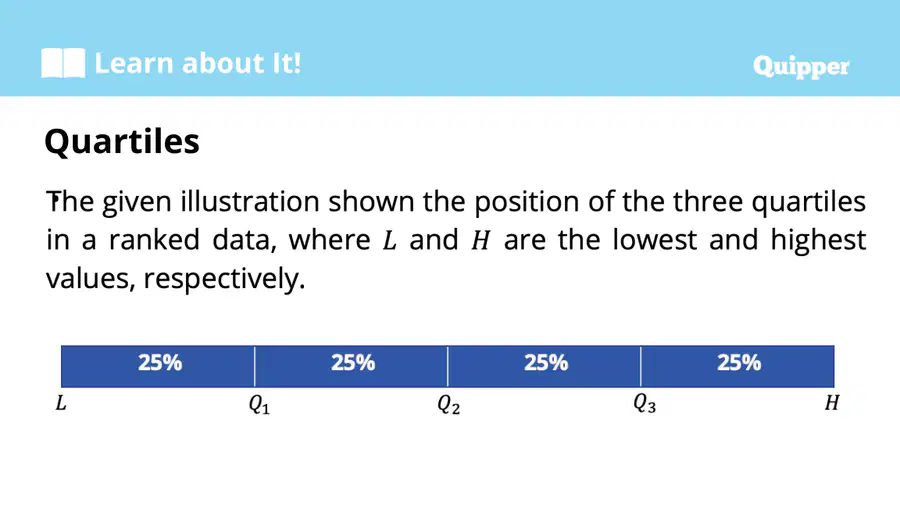
Explain how the positions of Q1, Q2, and Q3 divide a ranked data set. Why is this division useful in statistics?
26
27
Open Ended
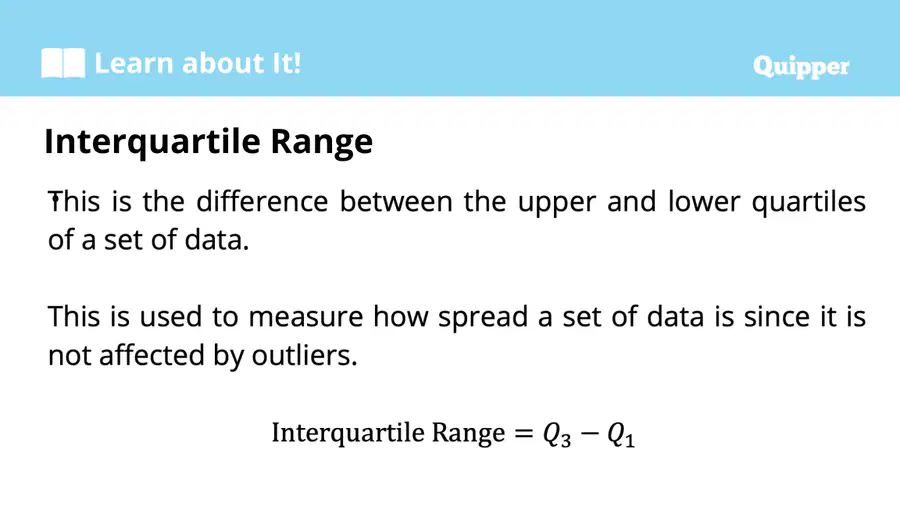
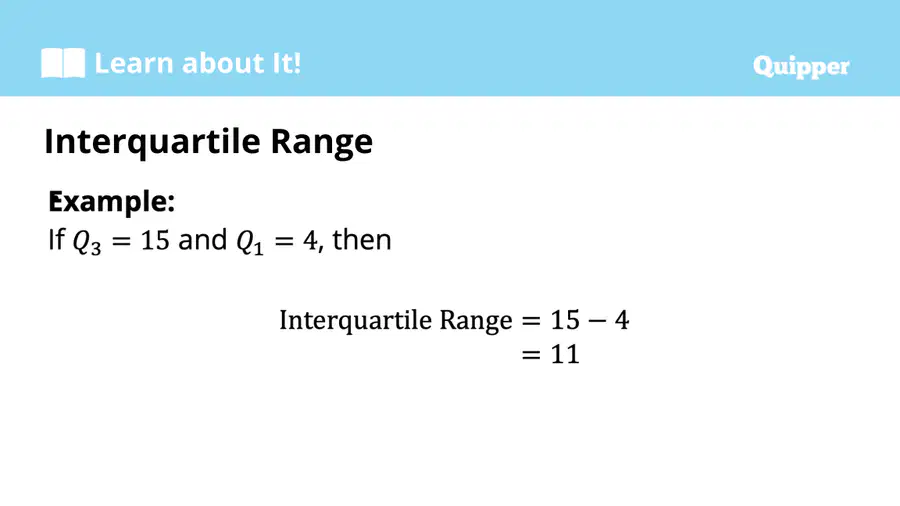
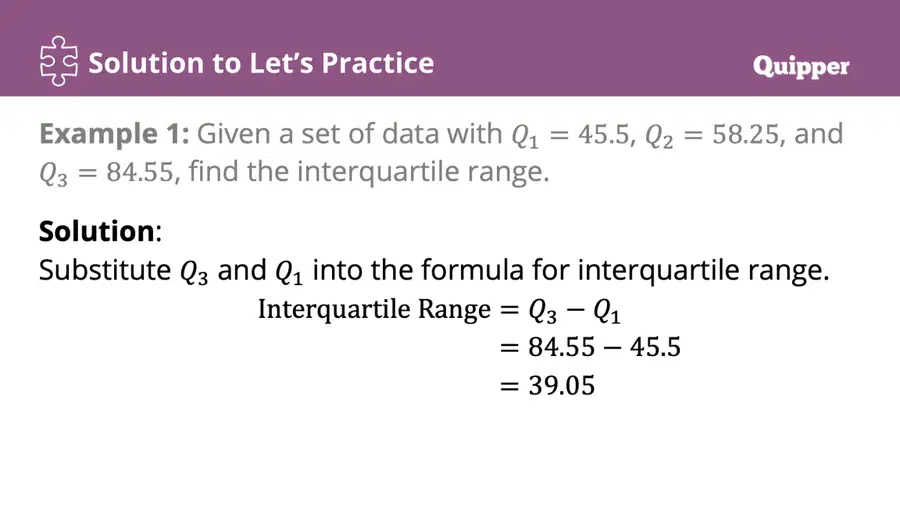
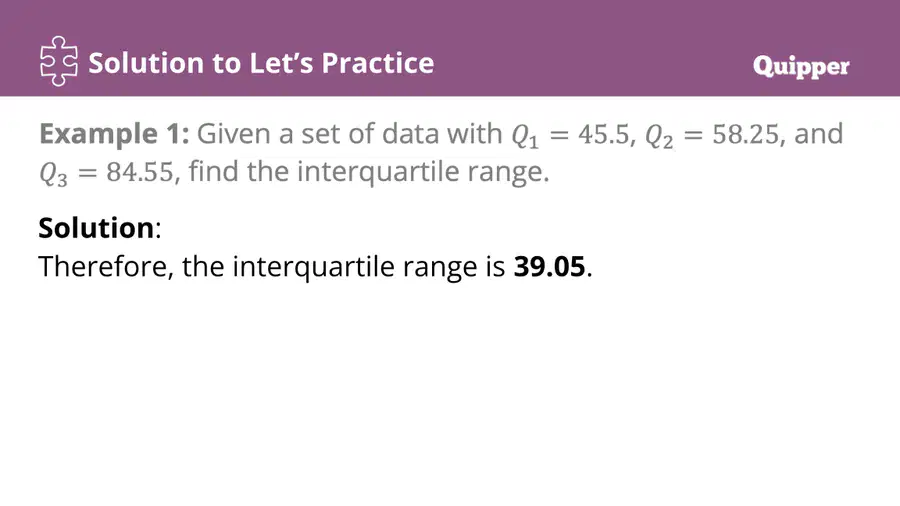
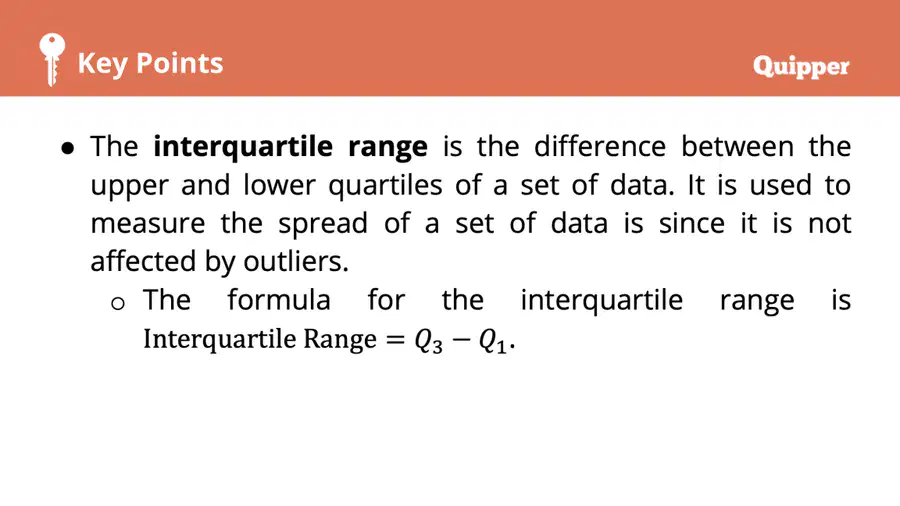
Describe how the interquartile range is calculated and explain its significance in analyzing data sets.
28
29
Multiple Choice
Which of the following values are needed to calculate the interquartile range?
Q1 and Q3
Q2 and Q3
Q1 and Q2
Q2 and Q4
30
Open Ended
Explain why the interquartile range is a useful measure of spread in a data set.
31
Multiple Choice
What is the formula for calculating the interquartile range?
Q3 + Q1
Q3 - Q1
Q1 - Q3
Q3 × Q1
32

33
34
35
Fill in the Blanks
Type answer...
36
37
38
Multiple Choice
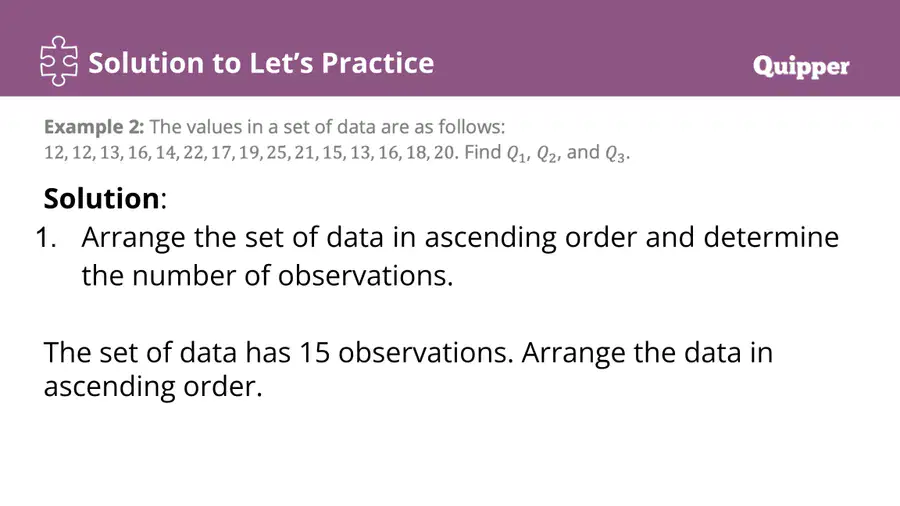
After arranging the data in ascending order, what is the next step to find Q1, Q2, and Q3?
Calculate the mean
Find the median and quartiles
Count the number of data points
Subtract the smallest value from the largest
39
Multiple Choice
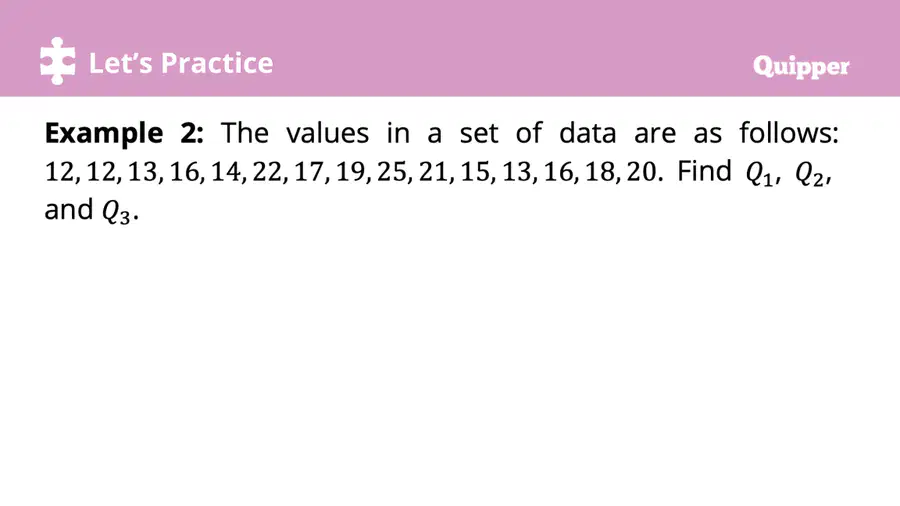
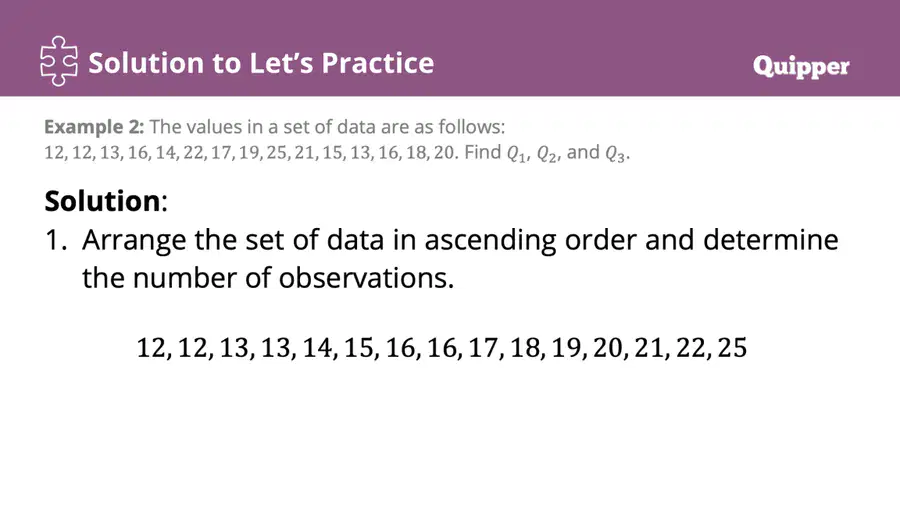
Arrange the following data in ascending order: 12, 12, 13, 16, 14, 22, 17, 19, 25, 21, 15, 13, 16, 18, 20.
12, 12, 13, 13, 14, 15, 16, 16, 17, 18, 19, 20, 21, 22, 25
12, 13, 12, 16, 14, 15, 17, 19, 25, 21, 13, 16, 18, 20, 22
12, 12, 13, 14, 15, 16, 17, 18, 19, 20, 21, 22, 25, 13, 16
12, 12, 13, 13, 14, 15, 16, 17, 18, 19, 20, 21, 22, 25, 16
40
41
Open Ended
Explain why it is important to arrange the data in ascending order before calculating quartiles.
42
Multiple Choice
What is the first step in finding the quartiles of a given data set?
Arrange the data in ascending order and determine the number of observations.
Calculate the mean of the data set.
Find the mode of the data set.
Group the data into intervals.
43
44
Multiple Choice
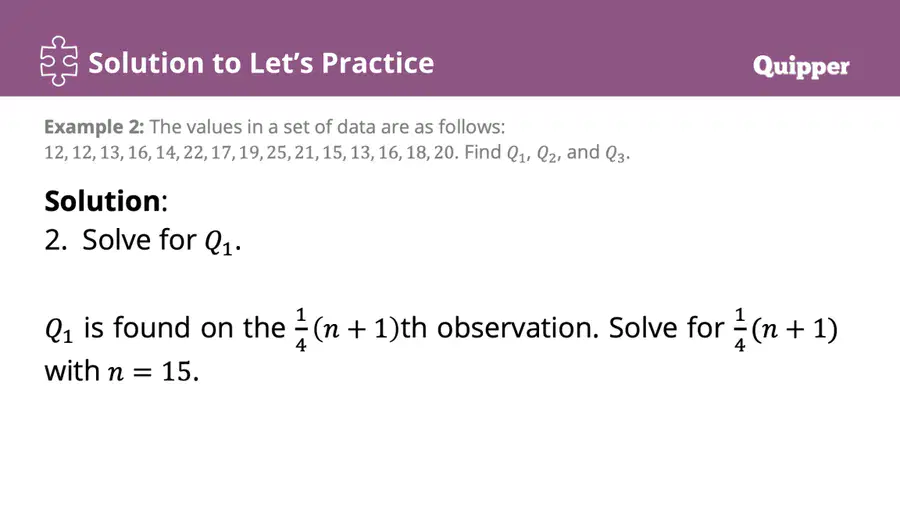
Which formula is used to find the position of Q1 in a data set with n observations?
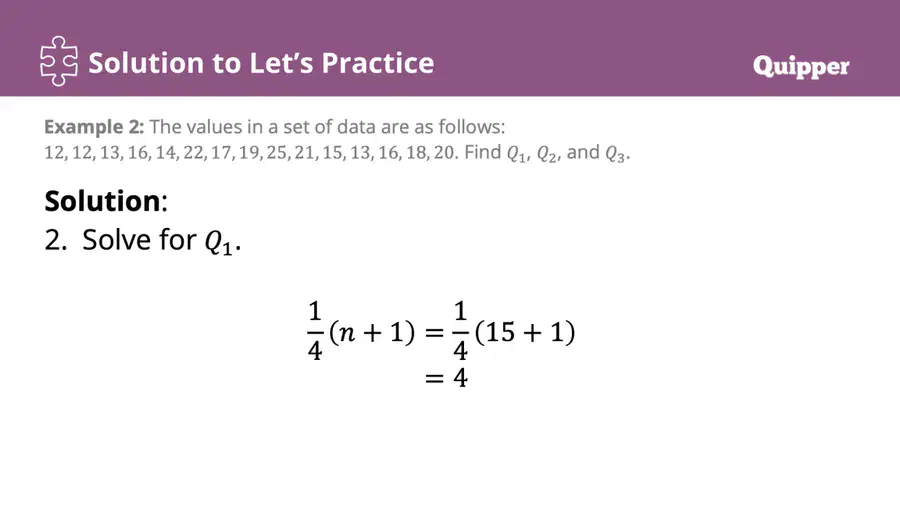
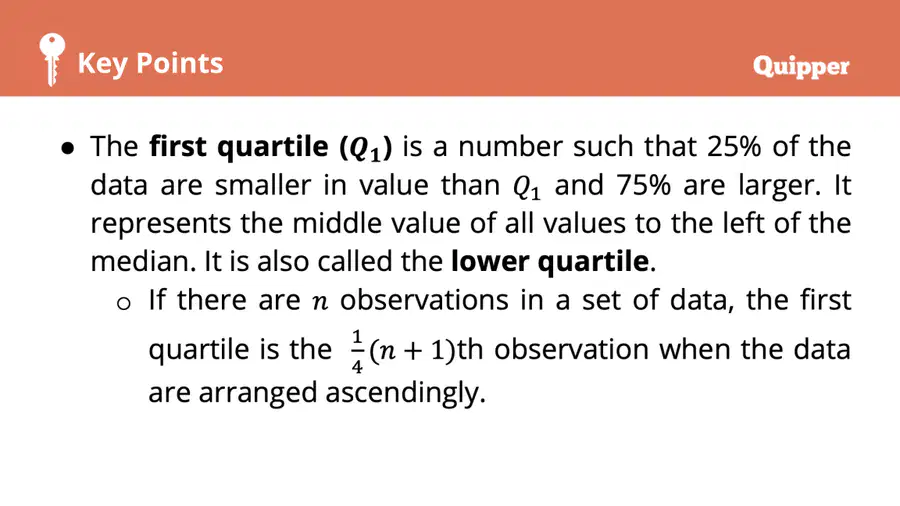
1/4(n + 1)
1/2(n + 1)
1/3(n + 1)
n/4
45
46
Fill in the Blanks
Type answer...
47
48
Multiple Choice
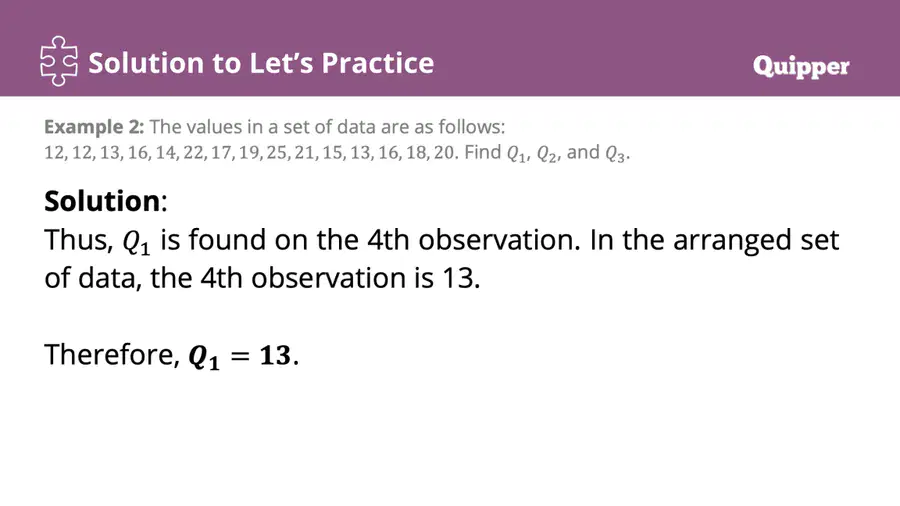
What is the value of Q1 for the given data set?
13
12
14
15
49
50
51
Multiple Select
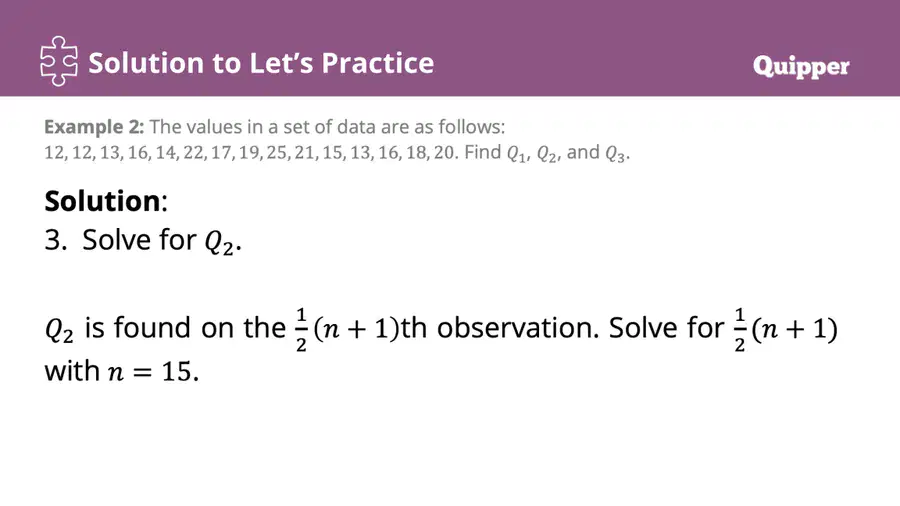
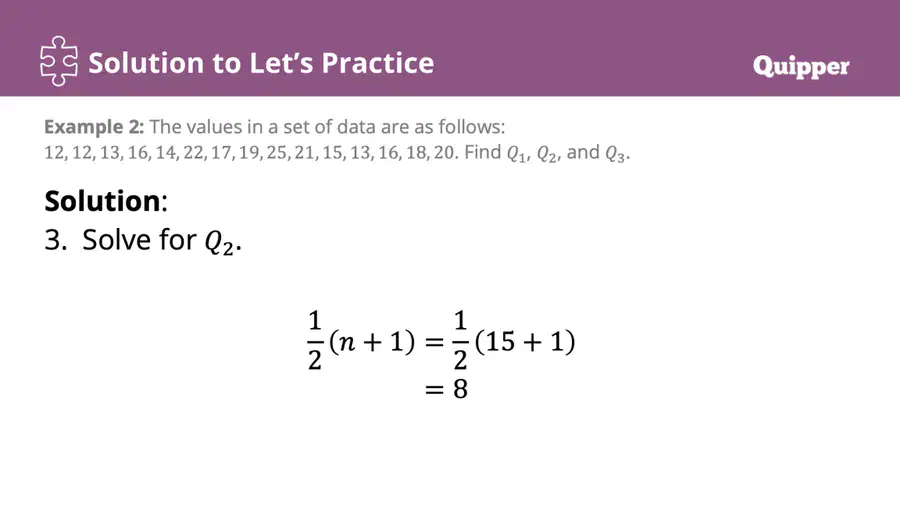
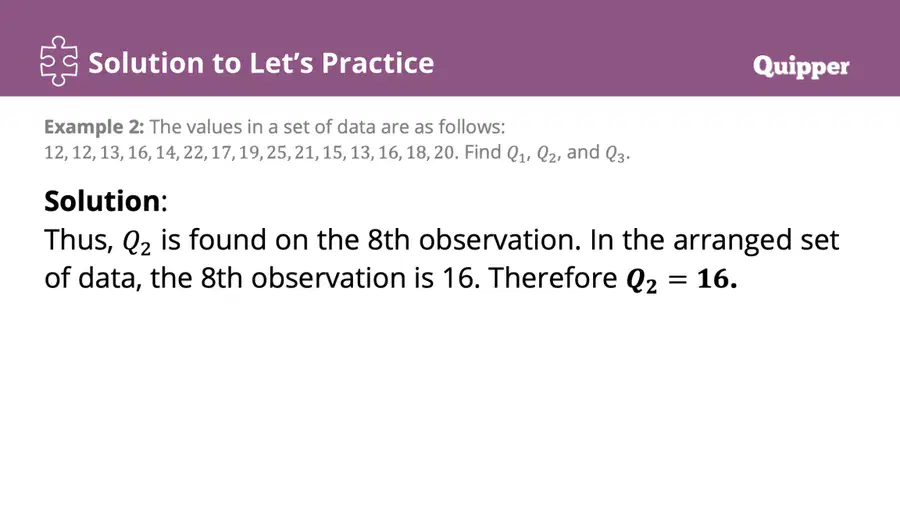
Select all correct statements about finding Q2 in a data set with 15 observations.
Q2 is found at the 8th observation.
Q2 uses the formula 1/2(n + 1).
Q2 is the median of the data set.
Q2 is always the smallest value in the data set.
52
53
54
55
56
57
58
59
60
61
62
63
64
Open Ended
How do you think understanding measures of position like quartiles, deciles, and percentiles can help you interpret data in real-life situations?
65
Multiple Choice
Which of the following is NOT a measure of position discussed in this lesson?
Quartiles
Deciles
Percentiles
Means
Show answer
Auto Play
Slide 1 / 65
SLIDE
Similar Resources on Wayground

65 questions
Math 2 1st Final Assessment Reviewer
Presentation
•
2nd Grade
57 questions
Root Words and Sentences
Presentation
•
2nd Grade
57 questions
Chapter 7 Multiplication and Division (x3, x4 and x6)
Presentation
•
3rd Grade
58 questions
SPA 1.1-1.4 REVIEW
Presentation
•
KG
60 questions
KISI-KISI ASTS GENAP - KELAS 2
Presentation
•
2nd Grade
61 questions
Greece
Presentation
•
KG
61 questions
CKLA 2nd Domain 7 Lesson 3
Presentation
•
2nd Grade
60 questions
2 AP 1st FA Reviewer
Presentation
•
2nd Grade
Popular Resources on Wayground
24 questions
PBIS-HGMS Day 10

Quiz
•
6th - 8th Grade
10 questions
HCS SCI 03 Summer School Review 3
Quiz
•
3rd Grade
11 questions
Home Scope
Quiz
•
7th - 8th Grade
15 questions
HCS SCI 05 Summer School Assessment 3 Review
Quiz
•
5th Grade
35 questions
Lufkin Road Middle School Student Handbook & Policies Assessment
Quiz
•
7th Grade
18 questions
Geo 11.3 Area of Circles and Sectors
Quiz
•
9th - 11th Grade