

5.6 Lesson (Sem) - Population Dynamics

Presentation
•
Science
•
9th - 12th Grade
•
Medium
+4
Standards-aligned

James Franks
Used 3+ times
FREE Resource
26 Slides • 49 Questions
1
Lesson: Population Dynamics

Which state has the most dense population of whitetail deer?
How many deer does this state mostly have per square mile?
Green - less than 15 deer per square mile
Yellow = 15 to 30 deer per square mile
Orange = 30 to 40 deer per square mile
Red = greater than 45 deer per square mile
2

Human Population Density 2023
Population: A group of the same species living in the same area.
Population Density: The number of individuals in a specific area (e.g., 45 deer per square mile).
3
A forest has 120 deer living in 4 square miles.
What is the population density of the deer?
a) 15 deer per square mile
b) 30 deer per square mile
c) 60 deer per square mile
d) 124 deer per square mile
4
Multiple Choice
A forest has 100 deer living in 4 square miles.
What is the population density of the deer?
5 deer per square mile
25 deer per square mile
50 deer per square mile
1 deer per square mile
5
Dispersion: the arrangement of individuals in a population or area
Clumped Dispersion - living in groups for safety, food resources, mating opportunities
Elephants
Uniform Dispersion - evenly spaced apart, decreases competition for resources
Creosote bushes evenly spread out due to limited water
Random Dispersion - randomly spaced apart, independence
Dandelions


6
How Populations Change Size:
Population Increase: Births & Immigration (moving In)
Population Decrease: Deaths & Emigration (moving out Exit)

7
Dropdown
Emigration
Mortality rate
Immigration
8
A wildlife biologist collects data on a population of field mice over the course of one year. Based on this data, which statement accurately describes the change in the mouse population?
a. The population increased because the birth rate is significantly higher than the death rate.
b. The population decreased because the total number of deaths and emigrations was greater than the total number of births and immigrations.
c. The population remained stable because the high emigration rate was balanced out by the high birth rate.
d. The population increased because the organisms moving into the area (immigration) added to the total.

9
Multiple Choice
A population of ducks in a wetland is monitored for one year:
Births: 40
Deaths: 25
Immigration (moving in): 15
Emigration (moving out): 30
What happens to the size of the duck population during this year?
The population increases by 5 ducks.
The population decreases by 5 ducks.
The population stays exactly the same.
The population doubles in size.
10
Exponential Growth (J-Curve) - Unlimited, "runaway" growth.
The population grows faster and faster.
Graph looks like the letter J.
resources are unlimited
there are no limiting factors (few predators, little competition).
Example: A new species in an ideal environment (like the rabbits in Australia).

Graphing Population Growth
11
A
B
Rate of Growth?
12
In 1859, European rabbits were introduced to Australia. The rabbits found an environment with abundant vegetation, favorable weather, and no natural predators. As a result, their population demonstrated "runaway" growth, as shown in the graph above. Which term best describes this type of population growth model?
a. Logistic growth
b. Carrying capacity
c. Exponential growth
d. Density-dependent growth

13
A population of bacteria is placed in a large petri dish with an unlimited supply of food and no competition. Under these ideal conditions, the population will grow [1]. This pattern is represented by a [2] on a graph, indicating that the population size is increasing [3].
1 - exponentially, logistically, linearly
2 - J-curve, S-curve, straight line
3 - at a constant rate, faster and faster, until it hits carrying capacity
14
Drag and Drop
15
Labelling
Label the Exponential Growth Graph
slow growth
fast growth
16
Multiple Choice

During what years was this population experiencing exponential growth (rapid growth)?
1-4
8-10
6-8
17
Multiple Choice
From what years did this population experience a crash (rapid decline)?
1-7
8-12
8-11
4-9
18
Multiple Choice

Logistic growth due to plenty of resources and no predators
Exponential due to plenty of resources and no predators
Logistic growth due to few resources and many predators
Exponential growth due to few resources and many predators
19
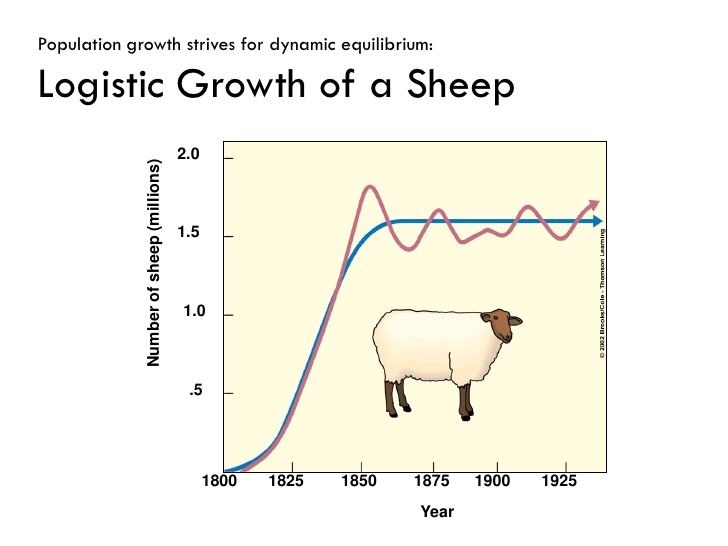
Logistic Growth (S-Curve): Realistic, natural growth that faces limits.
It starts fast, then slows down and levels off.
Graph shaped like the letter S.
Why it levels off: The population is limited by limiting factors.

Graphing Population Growth
If food and space decrease as a population grows, the population will usually shift from exponential growth to logistic growth.
20
A
B
C
D
Rate of Growth?
21
Multiple Choice
22
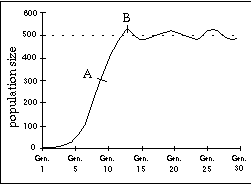
Carrying Capacity (K) is the maximum population size that an environment can support over a long time.
The flat, level line at the top of the S-curve.
23
Labelling
Label the Logistic Growth Graph
fast growth
slow growth
carrying capacity
24
Multiple Choice

The graph shows a population of fish introduced into a new pond with ample resources. Which statement best explains the sharp decline in the population after the initial spike?
The fish population stopped reproducing.
The fish population experienced exponential growth due to unlimited food.
A density-independent factor, such as a sudden freeze, must have occurred.
The population exceeded the pond's carrying capacity, leading to resource depletion.
25
Multiple Choice
26
Multiple Choice
The graph shows a stable population of squirrels in a park. What would most likely happen to the carrying capacity (K) if park managers cut down half of the oak trees, which are the squirrels' main food source?
The carrying capacity would decrease.
The carrying capacity would increase.
The carrying capacity would stay the same, but the population would grow exponentially.
The carrying capacity would stay the same, but the population would crash to zero.
27
Dropdown

28
Multiple Choice

Why would the carrying capacity of the wolves be smaller than that of the deer?
Since the deer are the wolves' food source, the deer must have a smaller carrying capacity.
Since the wolves are the deer's food source, the wolves must have a smaller carrying capacity.
Since the deer are the wolves' food source, the wolves must have a smaller carrying capacity.
Since the wolves are the deer's food source, the deer must have a smaller carrying capacity.
29
Dropdown

Unlimited population growth -
Carrying Capacity -
30
Dropdown
The local population of rabbits has predators and a certain amount of food
31
Multiple Choice

What kind of growth is this population experiencing?
Logistic growth due to unlimited resources and no predators
Exponential growth due to unlimited resources and no predators
Logistic growth due to limited resources and predators
Exponential growth due to limited resources and predators
32
Multiple Choice

What kind of growth is this population experiencing?
Logistic growth due to unlimited resources and no predators
Exponential growth due to unlimited resources and no predators
Logistic growth due to limited resources and predators
Exponential growth due to limited resources and predators
33
Multiple Choice
In a grassland ecosystem, the carrying capacity for lions (predators) is significantly lower than the carrying capacity for zebras (prey). Which statement best explains this relationship?
The lions are a density-independent factor for the zebras.
Energy is lost at each trophic level, so the ecosystem can support fewer top predators than primary consumers.
The zebras experience exponential growth, while the lions experience logistic growth.
The lions and zebras are competing for the same abiotic resources, which limits the lion population.
34
Overshoot & Crash:
When a population goes above carrying capacity, it is called an overshoot.
An overshoot can lead to a population sharp decline or "crash".
The population will then fluctuate around the carrying capacity.

35
Multiple Choice

Which change would most likely cause a population that is growing exponentially to shift to logistic growth?
A decrease in the number of predators.
An increase in available nesting sites.
A decrease in food availability as the population becomes crowded.
An increase in birth rate with plenty of resources.
36
Drag and Drop
37
Predator–prey cycles – prey numbers change first; predator numbers lag behind.

Prey increase → predator increase (more food).
As predators rise, prey decrease.
With less prey, predator numbers then decrease.
Predator graph lags behind prey graph.
Predators usually have a smaller carrying capacity than their prey because energy is lost at each trophic level.
38
In a stable ecosystem, if the prey population significantly increases, what will most likely happen to the predator population?
a. It will decrease because there is less competition.
b. It will increase because there is more available food.
c. It will stay the same.
d. It will migrate to a new area.
39
When looking at a graph of a predator-prey cycle, which of the following is true?
a. The predator population always peaks before the prey population.
b. The prey population always peaks after the predator population.
c. The predator population peaks after the prey population peaks.
d. Both populations peak at the exact same time.
40
What is the primary factor that causes a decrease in the predator population?
a. An increase in the prey population.
b. A decrease in the prey population.
c. An increase in producers.
d. A decrease in competition.
41
Reorder
Order the events in a typical predator-prey boom-bust cycle, starting with an abundance of prey.
Prey population increases rapidly.
Predator population increases due to more food.
Prey population decreases from over-predation.
Predator population decreases due to starvation.
42
Drag and Drop
43
Limiting factors stop a population from growing forever.
Density-dependent limiting factors usually have a stronger effect when a population is more crowded.
Usually BIOTIC (living) factors.
Examples of density-dependent factors include competition, disease, parasites, and predation.

44
Limiting factors stop a population from growing forever. Factors such as [1] are considered density-dependent because they usually involve [2] interactions and have a stronger effect when the population is [3].
1 - hurricanes and droughts, disease and predation, temperature and sunlight
2 - biotic / living, abiotic / non-living, weather-related
3 - more crowded, very small, spread out
45
Two species of fish in a small pond eat the same type of water plants. As the populations of both fish increase, the amount of available plants decreases. This causes the growth rate of both fish populations to slow down because there is not enough food for everyone. What type of limiting factor is described in this scenario?
a. A density-independent factor, because it involves a non-living resource.
b. A density-independent factor, because it affects the fish regardless of their population size.
c. A density-dependent factor, because the effect is caused by competition for resources in a crowded environment.
d. A density-dependent factor, because the fish are being limited by a predator that hunts them more easily.
46
Drag and Drop
47
Density-Independent Limiting Factors affect a population no matter how crowded it is.
Usually ABIOTIC (non-living) factors.
Examples of density-independent factors include droughts, floods, wildfires, and human activities.

48
Categorize
Disease
Wildfire
Predation
Drought
Competition
Match the limiting factor to its correct category.
49
Limiting factors that affect a population the same way, no matter how crowded it is, are called [1] factors. These are usually [2] factors, such as [3], which can destroy a habitat instantly.
1 - density-dependent, density-independent
2 - biotic / living, abiotic / non-living
3 - competition and disease, predation and parasites, wildfires and droughts
50
A severe hurricane moves inland from the Gulf Coast, knocking down trees and flooding the burrows of field mice in a forest ecosystem. The hurricane kills 80% of the mouse population, regardless of whether the population was large (crowded) or small (spread out). How would a biologist classify this hurricane as a limiting factor?
a. It is a density-dependent factor because it involves a non-living (abiotic) event.
b. It is a density-dependent factor because the mice were competing for shelter during the storm.
c. It is a density-independent factor because it affects the population size regardless of its density.
d. It is a density-independent factor because it involves a living (biotic) interaction between the storm and the mice.
51
Dropdown
52
Categorize
A shortage of available food and nesting sites
A sudden flood that introduces toxic pollutants into the water
The introduction of a new, highly effective predator
A population of fish in a river is limited by several factors.
53
Dropdown
More wolves are born and survive, reducing the population of deer -
54
Dropdown
Acid rain causes a lower pH in the soil and stunts the growth of many plants -
55
Multiple Choice
Which is a factor that affects the black bear population in Pickens County?
A longer growing season due to excess rainfall
A disease that affects blueberries, one of the main foods of blackbears
Fewer hunters due to new hunting laws for Pickens county
An increased water supply due to excess rainfall
56
Multiple Choice
Which graph represent the change in black bear population if a drought reduces the number of blueberry bushes in Pickens county?
57
Dropdown
A bacterial infection kills many mice in a population -
58
Dropdown
Higher than usual temperatures -
59
Dropdown
Access to sunlight -
60
Multiple Choice
Which situation describes a density-dependent limiting factor for a deer population?
A major hurricane destroys the trees and shrubs in the forest.
A long drought lowers water levels in ponds across the region.
A contagious disease spreads quickly in a crowded deer herd.
A volcanic eruption covers the area with ash.
61
Multiple Choice
A population of insects in a cornfield grows rapidly during the summer. In late summer, farmers spray pesticides that kill most of the insects, regardless of how many insects are present.
Which type of limiting factor is the pesticide?
Density-dependent, because it affects only small populations.
Density-dependent, because it becomes stronger as the population grows.
Density-independent, because it affects the population regardless of its size.
Density-independent, because it only affects insects that are predators.
62
Multiple Choice
In a national park, wolves are the main predator of elk. For several years, hunting of wolves is banned, and the wolf population increases.
What is the most likely effect on the elk population?
Elk population will increase because wolves are a density-independent factor.
Elk population will decrease because increased predation is a density-dependent factor.
Elk population will remain unchanged because predators do not affect carrying capacity.
Elk population will increase because more wolves mean more available resources.
63
Multiple Choice
In a grassland, a severe winter storm kills many rabbits, whether the population is large or small. The next year, a shortage of grass causes many rabbits to starve in the most crowded areas.
Which statement correctly classifies these limiting factors?
The storm is density-dependent, and the grass shortage is density-independent.
The storm is density-independent, and the grass shortage is density-dependent.
Both the storm and the grass shortage are density-dependent.
Both the storm and the grass shortage are density-independent.
64
If food and space decrease as a population grows, the population will usually shift from exponential growth to logistic growth.
65
Multiple Choice
Two ponds, Pond X and Pond Y, each contain a population of frogs. Both ponds start with 20 frogs. After several years:
>Pond X levels off around 60 frogs.
>Pond Y levels off around 120 frogs.
Which statement best explains the difference in carrying capacity between the two ponds?
Pond X has more predators and fewer food resources than Pond Y.
Pond X has fewer predators and more food resources than Pond Y.
Pond Y has fewer limiting factors than Pond X, so it has a higher carrying capacity.
Pond Y has more limiting factors than Pond X, so it has a higher carrying capacity.
66
Multiple Choice

The graph above shows the growth of a population of bacteria over time. Which statement best explains why the population growth levels off after day 25?
The rate of immigration began to exceed the rate of emigration.
The population reached the carrying capacity of its environment due to limited resources.
The population shifted from logistic growth to exponential growth.
A density-independent factor, such as a temperature drop, destroyed the population.
67
Drag and Drop
68
Multiple Choice
In the early 1900s, hunters in a specific region heavily targeted the passenger pigeon population. As the pigeons migrated in massive, dense flocks, they were easy targets for hunters, leading to a rapid decline in their numbers.
How is this limiting factor classified?
Density-independent, because humans are an abiotic factor.
Density-independent, because the hunting occurred regardless of the bird population size.
Density-dependent, because the high density of the bird flocks made it easier for hunters to find and kill them.
Density-dependent, because the birds were competing with the hunters for food.
69
PRACTICE
Questions
70
Drag and Drop
71
Dropdown
72
Multiple Choice
73
Multiple Choice
A pond loses half of its plant life after a drought.
What is the most likely effect on the carrying capacity for the fish population?
It increases because fish have more space.
It decreases because fewer resources are available.
It stays the same because carrying capacity never changes
It becomes exponential because drought removes predators.
74
Multiple Choice
Which statement best describes what happens to a population when it reaches its carrying capacity?
The population crashes to zero.
The population continues to grow exponentially.
The birth rate and death rate become approximately equal.
Density-independent factors stop affecting the population.
75
Categorize
Wildfire
Drought
Disease
Predation
Competition for food
Match the limiting factor to its correct classification.
Lesson: Population Dynamics
Which state has the most dense population of whitetail deer?
How many deer does this state mostly have per square mile?
Green - less than 15 deer per square mile
Yellow = 15 to 30 deer per square mile
Orange = 30 to 40 deer per square mile
Red = greater than 45 deer per square mile
Show answer
Auto Play
Slide 1 / 75
SLIDE
Similar Resources on Wayground

69 questions
Types of Chemical Reactions
Presentation
•
9th - 12th Grade
68 questions
Balancing and Identifying Chemical Reactions: A Review
Presentation
•
8th - 12th Grade
69 questions
Part 3 EOC Review
Presentation
•
10th Grade
66 questions
SS Chem Unit 4 Lesson
Presentation
•
9th - 12th Grade
70 questions
Review (Whole Year w/ Slides)
Presentation
•
KG - University
72 questions
Atoms and Elements Lesson
Presentation
•
9th - 12th Grade
70 questions
Unit 5 Test Remediation
Presentation
•
9th - 12th Grade
69 questions
Properties of Chemical Reactions
Presentation
•
9th - 12th Grade
Popular Resources on Wayground
24 questions
PBIS-HGMS Day 10

Quiz
•
6th - 8th Grade
10 questions
HCS SCI 03 Summer School Review 3
Quiz
•
3rd Grade
11 questions
Home Scope
Quiz
•
7th - 8th Grade
15 questions
HCS SCI 05 Summer School Assessment 3 Review
Quiz
•
5th Grade
35 questions
Lufkin Road Middle School Student Handbook & Policies Assessment
Quiz
•
7th Grade
18 questions
Geo 11.3 Area of Circles and Sectors
Quiz
•
9th - 11th Grade