
Tables and graphs
Presentation
•
Mathematics
•
7th - 12th Grade
•
Easy
+5
Standards-aligned
Sharon Rummins
Used 3+ times
FREE Resource
13 Slides • 27 Questions
1
PLOTTING STRAIGHT LINES
Learning goals:
To understand that a straight-line graph is formed from a linear rule
To be able to plot a graph of a rule using a table of values
To be able to use a straight line graph to determine the values of variables
2
Key ideas
3
Let's practice
3 questions follow to check understanding.....
4
Multiple Choice
The table shows the x and y values for the equation
y = x - 6.
What is the missing number?
12
10
14
13
5
Multiple Choice
The table shows the x and y values for the equation
y = 2x + 1.
Find the missing y value.
-2
3
9
-7
6
Multiple Choice
The table shows the x and y values for the equation
y = 9x - 1.
Find the missing y value.
-19
17
19
17
7
Can you find the rule and missing number?
8
Can you find the rule and missing number?
3 questions to check understanding ....
9 questions follow to check understanding.....
9
Multiple Choice
What is the rule (equation) for this table?
y = x + 5
y = 5x
y = x - 5
y = x - 5
10
Multiple Choice
What is the rule (equation for this table?
y = 480x
y = x + 479
y = x + 480
y = 480 - x
11
Multiple Choice
Which table is correct for y=4x+3?
12
Multiple Choice
Which equation matches the table?
13
Multiple Choice
Find the equation of the line
y = 16x
y = 2x +2
y = -2x -2
y = 4x + 0
14
Multiple Choice
Find the equation of the line
y =4x + 1
y = 3x -1
y = 8x +11
y = 12x + 56
15
Multiple Choice
Find the equation of the line
y = 4x + 2
y = 2x + 3
y = 3x - 1
y = 3x + 6
16
Multiple Choice
Three tables of values are shown.
Which table shows the x and y values for the equation
y = x + 5?
a
b
c
17
Multiple Choice
When a rule is written as a sentence:
The cost to hire a car from Easy Car Rental is $8.50 an hour plus a rental fee of $25.50.
c = 8.5 + 25.5
c = 25.5 + 8.5x
c = 8.5 + 25.5x
18
To find the y-intercept (c), substitute a coordinate pair into the equation.
Let's do this.
19
20
Now you try. Find the equation for this data.
2 questions follow to check understanding.....
21
Multiple Choice
Which equation describes the table shown?
y = x + 2
y = x - 2
y = 2x + 1
y = -2x + 2
22
Multiple Choice
Which equation matches the table?
y = x + 8
y = 2x + 3
y = x + 10
y = 3x - 4
23
When we know the gradient and y-intercept, we can graph our line.
24
And if we have a graphed line, we can find the equation.
Let's practice.
25
What are the equations of these lines?
5 questions follow to check understanding.....
26
Multiple Choice
Which is the graph of the equation y = -3x - 1?
27
Multiple Choice
Which graph represents the table?
28
Multiple Choice
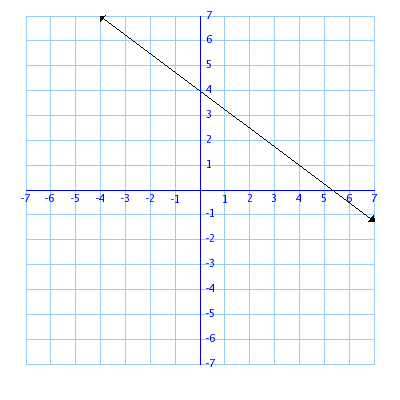
29
Multiple Choice
Which company shows a greater rate of change (gradient)?
30
Multiple Choice
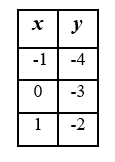
Which graph represents the table?
31
If we graph 2 lines together, we get a point of intersection where they cross over.
5 questions follow to check understanding.....
32
Multiple Choice
What is the point of intersection?
33
Multiple Choice
What is the point of intersection?
34
Multiple Choice
What is the point of intersection?
35
Multiple Choice
What is the point of intersection?
36
Multiple Choice
What is the point of intersection?
37
To summarise:
3 questions follow to check whether our learning goals have been achieved.....
38
Poll
How well do you understand that a straight-line graph is formed from a linear rule?
39
Poll
Are you able to plot a graph of a rule using a table of values?
40
Poll
Can you use a straight-line graph to determine the values of variables?
PLOTTING STRAIGHT LINES
Learning goals:
To understand that a straight-line graph is formed from a linear rule
To be able to plot a graph of a rule using a table of values
To be able to use a straight line graph to determine the values of variables
Show answer
Auto Play
Slide 1 / 40
SLIDE

Similar Resources on Wayground
35 questions
Categorical Data
Presentation
•
7th - 12th Grade
34 questions
Патофизиология надпочечников и репродуктивной системы
Presentation
•
KG
36 questions
tener + que + infinitive
Presentation
•
8th - 12th Grade
36 questions
Causes of the Stock Market Crash
Presentation
•
8th - 12th Grade
34 questions
Solving Radical Equations
Presentation
•
9th - 12th Grade
37 questions
What is a Function? Part 1 Completing Tables
Presentation
•
7th - 12th Grade
35 questions
Polygon
Presentation
•
KG
38 questions
Graphing Linear Inequalities
Presentation
•
KG
Popular Resources on Wayground
24 questions
PBIS-HGMS Day 10
Quiz
•
6th - 8th Grade
10 questions
HCS SCI 03 Summer School Review 3
Quiz
•
3rd Grade
11 questions
Home Scope
Quiz
•
7th - 8th Grade
15 questions
HCS SCI 05 Summer School Assessment 3 Review
Quiz
•
5th Grade
35 questions
Lufkin Road Middle School Student Handbook & Policies Assessment
Quiz
•
7th Grade
18 questions
Geo 11.3 Area of Circles and Sectors
Quiz
•
9th - 11th Grade