

Data Analysis

Presentation
•
Mathematics
•
3rd Grade
•
Practice Problem
•
Hard
+1
Standards-aligned

Marlene Morales-Blanco
Used 50+ times
FREE Resource
1 Slide • 11 Questions
1
2
Multiple Choice

The frequency table shows the results of a survey about how many days per week some families eat dessert.
Which dot plot represents the data in the table?
3
Multiple Choice

The graph below shows the number of miles Lincoln rode his bike during six weeks.
Which table represents the information int he graph?
4
Multiple Choice

A school keeps boxes of paper of different colors in a room. The table shows how many boxes of each color are in the room.
Which answer choice does NOT represent the information in the table?
5
Fill in the Blanks
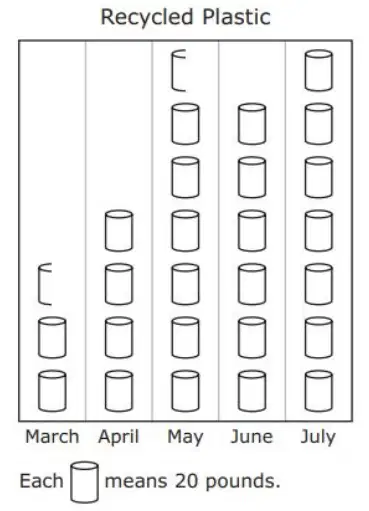
The graph shows the number of pounds of plastic the Keller family recycled for five months.
Based on the graph, how many more pounds of plastic did the family recycle in July than in April?
6
Fill in the Blanks
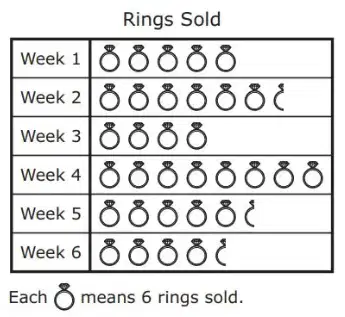
The graph shows the number of rings Mrs. Adams sold during six weeks at her jewelry store.
What is the total number of rings Mrs. Adams sold during weeks 4, 5, and 6?
7
Fill in the Blanks
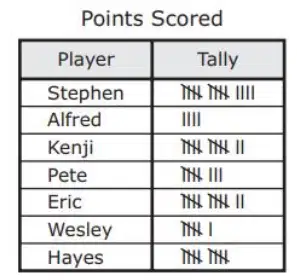
The frequency table shows the number of points scored by each player on a basketball team during a game.
What is the combined number of points scored by Stephen, Alfred, Pete, and Wesley?
8
Fill in the Blanks
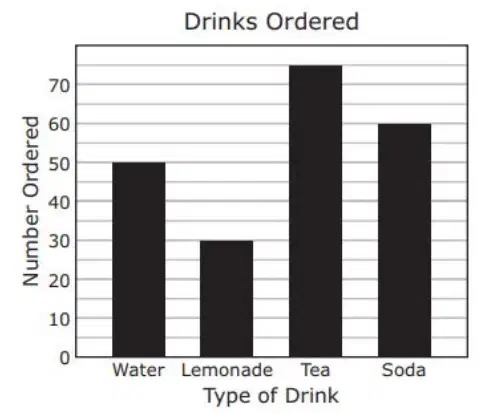
The bar graph shows the number of each different type of drink that was ordered in a restaurant one day.
What was the total number of drinks ordered?
9
Multiple Choice

The bar graph shows the number of third graders who bought lunch to school each day last week.
Which table best represents the data in the graph?
10
Multiple Choice

Which pictograph best represents the information in the list?
11
Fill in the Blanks
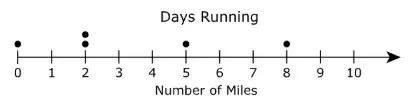
The dot plot shows the numbers of miles Joseph ran on five days. Joseph ran on one more day, but the dot is missing from the dot plot.
Joseph ran a total of 25 miles during the six days. How many miles did Joseph run on the sixth day?
12
Multiple Choice

Merlin had a bag of tiles. Each tile was labeled with a number. Merlin pulled one tile out of the bag and recorded the number on that tile. He repeated this 18 times. The numbers on the tiles Merlin pulled are shown in the list.
8, 7, 12, 1, 8, 9, 12, 0, 7, 8, 10, 4, 5, 8, 12, 4, 0, 8
Which dot plot represents the numbers on the tiles Merlin pulled out of the bag?
Show answer
Auto Play
Slide 1 / 12
SLIDE

