Search Header Logo
Maps Earth Science

Maps Earth Science

Assessment

Presentation

•

Science

•

8th - 10th Grade

•

Hard

Created by

Joseph Anderson

FREE Resource

13 Slides • 17 Questions

1

media

2

media

​Some text here about the topic of discussion.

​Map Review for Earth Science

​

We study large objects, like the Earth and it's ecosystems with Maps! They can tell us so much! ​

​

3

Parts of a map
  • Title

  • Key or legend

media

4

Parts of a map
  • Compass Rose

media

5

Parts of a map
  • Scale

media

6

media

7

media

8

media

9

media

10

media

11

media
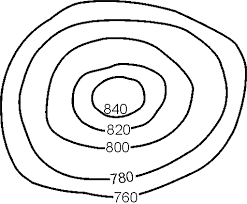
​Topographic Map

​Topographic maps show us the elevation of an area.

The lines on a topographic map are called Contour Lines.

the closer they are together, the more step the gradient of that landform.

Gentle slopes are shown by lines that are further apart.

Topographic maps with have a set interval (number of meters) between each contour line. ​

media

12

media

13

media

14

Multiple Choice

Question image

10) Which point on the diagram correctly locates 15° S and 30° W?

1

Z

2

Y

3

X

4

W

15

Multiple Choice

The ___________________________ shows the cardinal directions (Never Eat Soggy Waffles).

1

Title

2

Scale

3

Compass Rose

16

Multiple Choice

You can use a scale on a map to:
1
Find out how much the map weighs
2
Determine the distance from one point to another
3
Understand the meaning of the map's symbols
4
Dance the night away

17

Multiple Choice

The purpose of a map legend (or key) is:

1

To explain the history of the map

2

To figure out the distance from one place to another

3

To identify the meaning of symbols on the map

18

Multiple Choice

Question image
What is this object known as?
1
map symbol
2
map key
3
map scale
4
compass rose

19

Multiple Choice

Question image

What is this called?

1

Compass Rose

2

Map Key

3

Map Scale

4

Compass

20

Multiple Choice

Question image

4) What is the approximate latitude and longitude of the sunken ship?

1

20.5° S , 70° W

2

20.5° S. 70° E

3

20.5° N, 70° W

4

20.5° N, 70° E

21

Multiple Choice

Question image
The playground is ______ of the park.
1
South
2
North
3
West

22

Multiple Choice

Robbie made a scale drawing of a neighborhood park. A soccer field in the park is 14 cm long in the drawing. The actual field is 98 metres long. What is the scale of the drawing?

1 centimetre = ___ metres.

1

1372

2

500

3

1400

4

700

23

Multiple Choice

Question image
What is the elevation of point B?
1
800 ft
2
850 ft
3
900 ft
4
1000 ft

24

Multiple Choice

Question image

The image shows a topographic map.


Which statement best describes the location marked by the X?

1

It is at the bottom of a large pit.

2

It is at the top of a hill.

3

It is on the side of a mountain.

4

It is in a deep cave.

25

Multiple Choice

Question image
Determine the contour interval:
1
5 m
2
10 m
3
15 m
4
20 m

26

Multiple Choice

What does it tell you about a hill if the contour lines on the East side of the hill are very close together on a topographic map?
1
The West side of the hill is very steep
2
The East side of the hill is very steep.
3
The north side of this hill has a river on it
4
The East side of this hill is very flat

27

Multiple Choice

Question image
In which direction is Mill River flowing?
1
Southeast
2
Southwest
3
Northeast
4
Northwest

28

Multiple Choice

What type of map would be most helpful if you were looking for a steep trail to hike?

1

Geologic Map

2

Projection Map

3

3D Map

4

Topographic Map

29

Multiple Choice

What type of map would be useful to find an area where a geologist would be able to drill to find oil?

1

Geologic Map

2

Projection Map

3

Topographic map

4

3D Map

30

Multiple Choice

Question image

The pink area represents ________________ people/km2

1

430-990

2

230-420

3

110-220

4

1000-3230

pattern-tertiary
media

Show answer

Auto Play

Slide 1 / 30

SLIDE