

Representations of Proportional Relationships Skills Practice

Presentation
•
Mathematics
•
8th Grade
•
Practice Problem
•
Medium
+5
Standards-aligned

Karina Valenzuela
Used 3+ times
FREE Resource
13 Slides • 12 Questions
1

Representations of
Proportional
Relationships
Skills Practice
2

At a large company, the total number of employees varies
directly with the number of employees that drive to work. The company determines that two out of every three of its total employees drive to work. The other employees walk or use public transportation. Use the information to determine each number of employees.
1.
The number of total employees if there are 150
employees that drive to work.
3
Fill in the Blanks
1. The number of total employees if there are 150 employees that drive to work.
4

At a large company, the total number of employees varies directly with
the number of employees that drive to work. The company determines
that two out of every three of its total employees drive to work. The other employees walk or use public transportation. Use the information to determine each number of employees.
2. The number of total employees if there are 85 employees that do not drive to work.
5
Fill in the Blanks
2. The number of total employees if there are 85 employees that do not drive to work.
6

At a large company, the total number of employees varies directly with the number of employees that drive to work. The company determines that two out of every three of its total employees drive to work. The other employees walk or use public transportation. Use the information to determine each number of employees.
3. The number of employees that do not drive to work if there are 240 total employees.
7
Fill in the Blanks
3. The number of employees that do not drive to work if there are 240 total employees.
8

At a large company, the total number of employees varies directly with the
number of employees that drive to work. The company determines that two out of every three of its total employees drive to work. The other employees walk or use public transportation. Use the information to determine each number of employees.
4. The number of employees that drive to work if there are 570 total employees.
9
Fill in the Blanks
4. The number of employees that drive to work if there are 570 total employees.
10

At a large company, the total number of employees varies directly
with the number of employees that drive to work. The company
determines that two out of every three of its total employees drive to work. The other employees walk or use public transportation. Use the information to determine each number of employees.
5. The number of employees that drive to work if there are 330 employees that do not drive to work.
11
Fill in the Blanks
5. The number of employees that drive to work if there are 330 employees that do not drive to work.
12

At a large company, the total number of employees varies directly with the number of employees that drive to work. The company determines that two out of every three of its total employees drive to work. The other employees walk or use public transportation. Use the information to determine each number of employees.
6. The number of employees that do not drive to work if there are 770 employees that drive to work.
13
Fill in the Blanks
6. The number of employees that do not drive to work if there are 770 employees that drive to work.
14
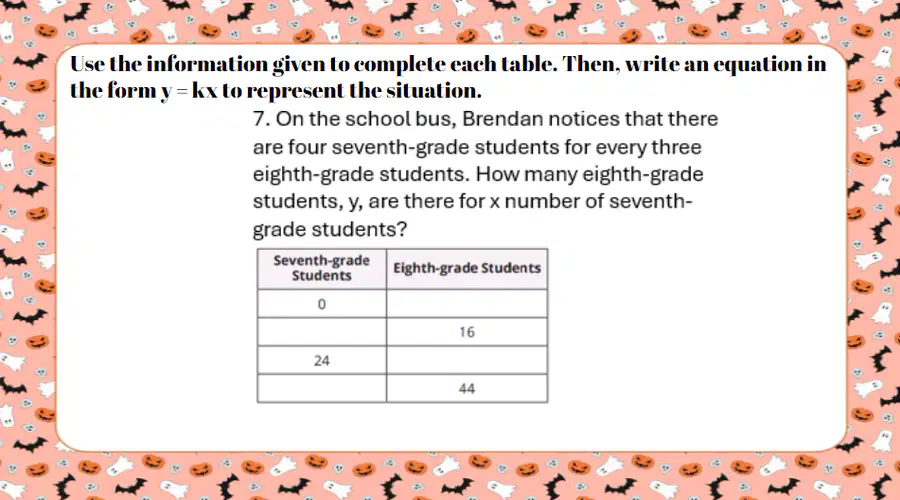
15
Multiple Choice
Choose the correct table.
16

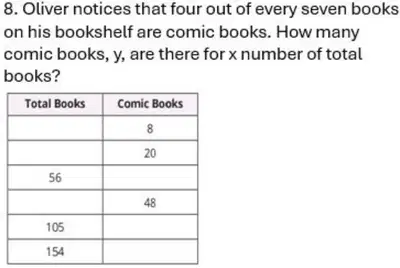
Use the information given to complete each table. Then, write an equation in the form y = kx to represent the situation.
17
Multiple Choice
Choose the correct table.
18

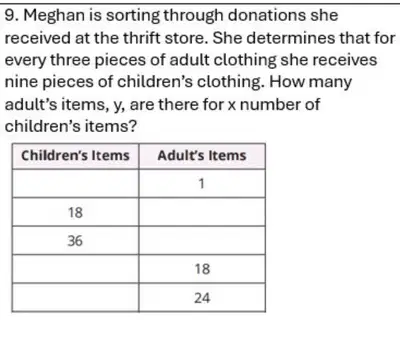
Use the information given to complete each table. Then, write an equation in the form y = kx to represent the situation.
19
Multiple Choice
Choose the correct answer.
20


Use the information given to complete each table. Then, write an equation in the form y = kx to represent the situation.
21
Multiple Choice
Choose the correct answer
22


11. Each graph represents two proportional relationships. Determine the constant of proportionality for each line.
23
Dropdown
Y2: K=
24


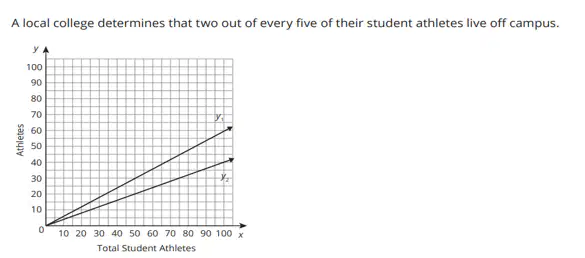
12. Each graph represents two proportional relationships. Determine the constant of proportionality for each line.
25
Dropdown
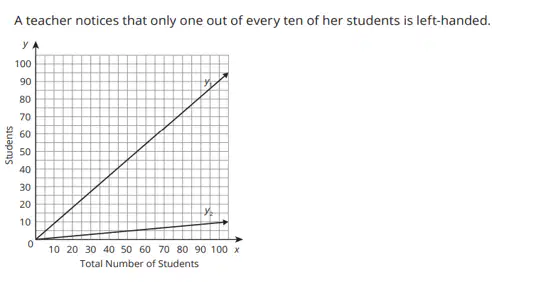
Y2: K=
Representations of
Proportional
Relationships
Skills Practice
Show answer
Auto Play
Slide 1 / 25
SLIDE
Similar Resources on Wayground

19 questions
Quadratic Formula & the Discriminant
Presentation
•
8th Grade
18 questions
Expressions with Square Roots
Presentation
•
8th Grade
21 questions
Slope-intercept form
Presentation
•
8th Grade
20 questions
Mixed Numbers
Presentation
•
4th - 5th Grade
20 questions
Dilations & Similar & Congruent
Presentation
•
8th Grade
20 questions
Box Plots
Presentation
•
8th Grade
19 questions
Square Root and Cube Root Review
Presentation
•
8th Grade
19 questions
Transformations
Presentation
•
8th Grade
Popular Resources on Wayground
10 questions
Safety Day 2026 – Student Review

Quiz
•
9th Grade
21 questions
Continents and Oceans
Quiz
•
6th Grade
20 questions
Parts of Speech
Quiz
•
5th Grade
16 questions
Subject & Predicate
Quiz
•
5th Grade
25 questions
Multiplication Facts
Quiz
•
5th Grade
12 questions
Map Skills
Quiz
•
3rd Grade
22 questions
Continents and Oceans
Quiz
•
5th Grade
15 questions
Rounding Decimals
Quiz
•
5th Grade
Discover more resources for Mathematics
20 questions
Rational and Irrational Numbers
Quiz
•
8th Grade
20 questions
Add and Subtract Integers
Quiz
•
6th - 8th Grade
20 questions
Slope from a Graph
Quiz
•
8th Grade
15 questions
Adding and Subtracting Integers
Quiz
•
6th - 8th Grade
20 questions
Proportional vs. Non-Proportional
Quiz
•
8th Grade
14 questions
finding slope from a graph
Quiz
•
8th Grade
24 questions
Explore Rigid Transformations and Congruence
Quiz
•
8th Grade
13 questions
Finding slope from graph
Quiz
•
8th Grade