

Introduction to Graphing

Presentation
•
Biology
•
9th - 12th Grade
•
Practice Problem
•
Easy

Jennifer Long
Used 6+ times
FREE Resource
9 Slides • 5 Questions
1
1. Title
2. The independent variable (w/ axis title)
3. The dependent variable (w/ axis title)
4. The scales for each variable
5. A legend or key (if necessary)
A graph contains five major parts: (5 MGP: “5 Major Graph Parts”)
Graphing is an important procedure used by scientists to display the data that is collected during a controlled experiment. Graphs must be constructed correctly to accurately portray the data collected for analysis. Many times the wrong construction of a graph inaccurately portrays data or skews perception about a data set, so being able to accurately create and analyze a graph is an extremely important scientific skill.
Graphing
Introduction to Graphing
2
The TITLE: depicts what the graph is about. By reading the title, the reader should get an idea about the graph. It should be a concise statement placed above the graph.
TITLE
A graph Contains...
3
The INDEPENDENT VARIABLE: is the variable that can be controlled or manipulated by the experimenter. It usually includes time (dates, minutes, hours, etc.), depth (feet, meters), and temperature (Celsius). This variable is placed on the X axis (horizontal axis). [MIX - manipulated, independent, X]
INDEPENDENT VARIABLE
A graph Contains...
4
The DEPENDENT VARIABLE: is the variable that is directly affected by the independent variable or responds to changes in the independent variable. It is the result of what happens because of the independent variable. Example: How many oxygen bubbles are produced by a plant located five meters below the surface of the water? The oxygen bubbles are dependent on the depth of the water. This variable is placed on the Y or vertical axis. [DRY - dependent, responding, Y]
DEPENDENT VARIABLE
A graph Contains...
5
The SCALES for each variable: In constructing a graph one needs to know where to plot the points representing the data. In order to do this, a consistent scale must be utilized to include all the data points. The scale should also take up a conservative amount of space. It is not suggested to have a run-on scale making the graph too hard to manage. The scale should start with 0 and climb or decrease based on intervals such as: multiples of 2, 5, 10, 20, 25, 50, or 100. The scale of numbers will be dictated by your data values. Scales must be consistent, with number intervals spaced evenly!
SCALES
A graph Contains...
6
The LEGEND/KEY: is the meaning of the symbols used in a graph or map. This could include shapes or colors to help the reader determine what the lines or bars on a graph mean. Always use a legend/key if more than one data set is represented on the same graph.
LEGEND/KEY
A graph Contains...
7


allow us to compare groups or categories
Bar Graphs
allow us to show trends over time or in sequential order
Line Graphs
Types of Graphs
8
is anything that can be counted or measured; it refers to numerical data
Quantitative Data
is descriptive, referring to things that can be observed but not measured
Qualitative Data
Data
9
Open Ended
What are the 5 major graph parts that should always be included when creating a graph?
10
Open Ended
Write TWO statements to summarize 2 other things you learned about graphs from this page:
11

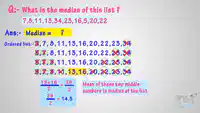
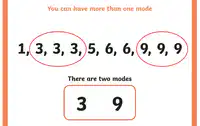
Mean
The MEDIAN for a group of variables: To determine median or “middle” for an even number of values, put the values in ascending order and take the average of the two middle values. e.g. 2, 3, 4, 5, 9, 10 Add 4+5 (2 middle values) and divide by 2 to get 4.5
Median
The MODE for a group of variables: The mode for a group of values is the number that occurs most frequently. e.g. 2, 5, 8, 2, 6, 11 The number 2 is the mode because it occurred most often (twice).
Mode
The MEAN for a group of variables: To determine the mean for a group of variables, divide the sum of the variable by the total number of variables to get an average.
12
Multiple Choice
What does the term independent variable mean?
The term independent variable refers to the factor that is manipulated
13
Multiple Choice
What does the term dependent variable mean?
14
Match
Match the following:
Mean
Median
Mode
The average
The middle value
The most frequent value
The average
The middle value
The most frequent value
1. Title
2. The independent variable (w/ axis title)
3. The dependent variable (w/ axis title)
4. The scales for each variable
5. A legend or key (if necessary)
A graph contains five major parts: (5 MGP: “5 Major Graph Parts”)
Graphing is an important procedure used by scientists to display the data that is collected during a controlled experiment. Graphs must be constructed correctly to accurately portray the data collected for analysis. Many times the wrong construction of a graph inaccurately portrays data or skews perception about a data set, so being able to accurately create and analyze a graph is an extremely important scientific skill.
Graphing
Introduction to Graphing
Show answer
Auto Play
Slide 1 / 14
SLIDE
Similar Resources on Wayground

10 questions
Evolution Part I- What is evolution?
Presentation
•
9th - 12th Grade
10 questions
Blood Types
Presentation
•
9th - 12th Grade
10 questions
Decision Making
Presentation
•
9th - 12th Grade
10 questions
Subjuntivo
Presentation
•
9th - 12th Grade
13 questions
Succession Lesson
Presentation
•
9th - 11th Grade
11 questions
Camera Angles
Presentation
•
9th - 12th Grade
10 questions
Incomplete Dominance/Codominance
Presentation
•
9th - 12th Grade
12 questions
Scientific Method
Presentation
•
9th - 12th Grade
Popular Resources on Wayground
24 questions
PBIS-HGMS Day 10

Quiz
•
6th - 8th Grade
10 questions
HCS SCI 03 Summer School Review 3
Quiz
•
3rd Grade
11 questions
Home Scope
Quiz
•
7th - 8th Grade
15 questions
HCS SCI 05 Summer School Assessment 3 Review
Quiz
•
5th Grade
35 questions
Lufkin Road Middle School Student Handbook & Policies Assessment
Quiz
•
7th Grade
18 questions
Geo 11.3 Area of Circles and Sectors
Quiz
•
9th - 11th Grade