

Line of Best Fit Lesson + Review

Presentation
•
Mathematics
•
8th Grade
•
Practice Problem
•
Medium
+5
Standards-aligned

Sarah Francis
Used 10+ times
FREE Resource
8 Slides • 17 Questions
1
2

3

4

5

6
Multiple Choice

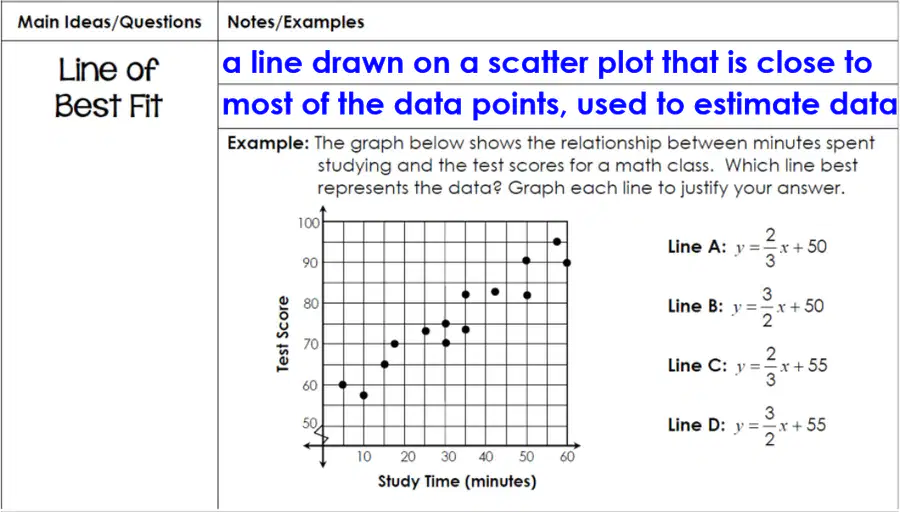
Which line would be the line of best fit?
7
Multiple Choice

A 10 inch candle is lit. The scatterplot shows the height after each hour. What relationship does the scatter plot show?
8


9

10
Multiple Choice

The graph shows the ages (in months) and the weights (in pounds) of 12 babies. What kind of relationship does the graph show?
11
Multiple Choice

What could be a reasonable weight for a 14 month old baby according to the data?
12
Multiple Choice

The graph shows Beth's bank account over the first year. What was her starting balance?
13
Multiple Choice

Which is a reasonable estimation for how much money will be in her account in 15 months?
14
Multiple Choice

Which equation could be the line of best fit for this graph?
15
Multiple Choice
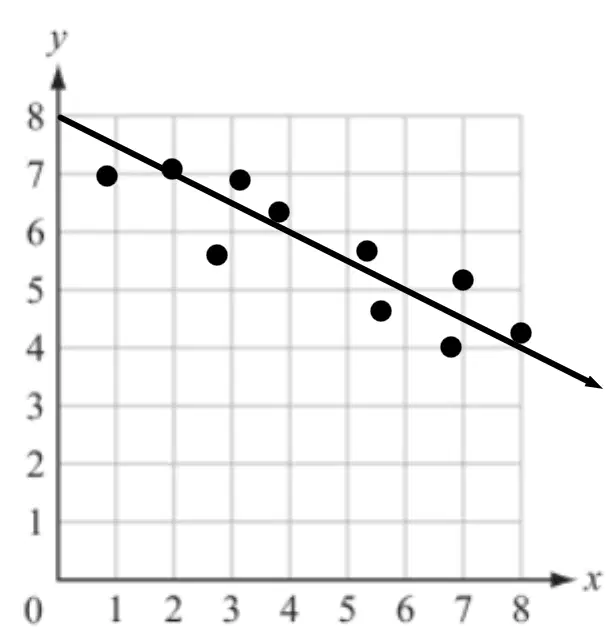
Which could be the equation for the line of best fit?
16
17
Multiple Choice
18
Multiple Choice

What is the probability of drawing a red marble, replacing the marble, then drawing a blue marble?
19
Multiple Choice
What is the probability of drawing a red marble, not replacing the marble, then drawing a blue marble?
20
Multiple Choice
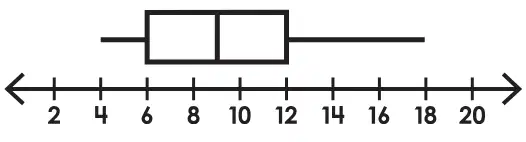
According to the boxplot what is the upper quartile?
21
Multiple Choice
According to the boxplot what is the median?
22
Multiple Choice
What is the interquartile range?
23
Multiple Choice
What percent of the data is greater than 12?
24
Multiple Choice
What percent of the data is between 4 and 12?
25
Multiple Choice
If there are 20 people in this data, how many were between 6 and 18?
Show answer
Auto Play
Slide 1 / 25
SLIDE

