Looking for Associations
Presentation
•
Mathematics
•
8th Grade
•
Practice Problem
•
Hard
+1
Standards-aligned
Chavonda Brown
Used 3+ times
FREE Resource
23 Slides • 8 Questions
1
Looking for
Associations
Lesson 9
Download for free at openupresources.org.
2019 Open Up Resources |
2
Let’s look for
associations in
data!
3
Notice and Wonder:
Bar Association
Activate: Warm Up Activity 9.1
4
What do you notice? What do you wonder?
5
Matching Representations
Comprehend/Apply: Activity 9.2
● MLR8: Discussion Supports
● MLR2: Collect and Display
6
Why do you think this is called a “two-way table”?
7
What does the 25 mean? What does the 55 mean?
8
How many people are represented in this table?
9
Why do you think this is called a “bar graph?”
10
What do the blue bars represent? How do you know?
11
Where does the 25 from the table show up in this
bar graph?
12
Why do you think this is called a “segmented bar graph”?
13
What do you think the vertical axis represents?
14
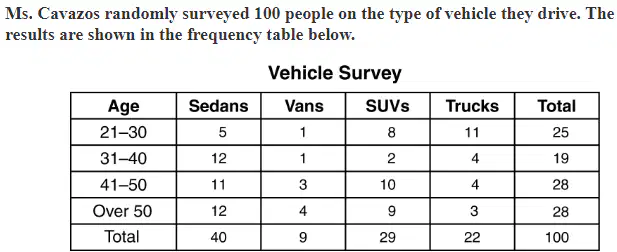
Let's practice identifying data in a frequency table.
15
Multiple Choice
Based on the data, which statement is true?
The lowest percentage of type of vehicle driven overall is trucks.
More people aged 41–50 drive sedans and vans than drive SUVs and trucks.
A greater percentage of people aged 41–50 drive trucks than people aged 31–40
The same number of people aged 21–30 drive trucks as all other age groups combined.
16
Multiple Choice
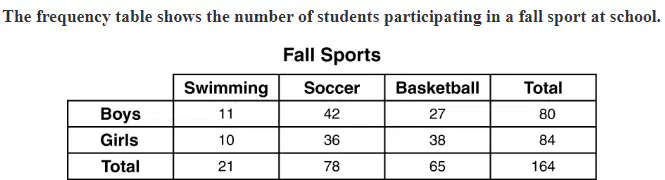
What is the ratio of the number of girls who participated in soccer to the number of girls who participated in basketball?
HINT: Simplify your ratio.
9:41
6:13
18:19
19:18
17
Multiple Choice
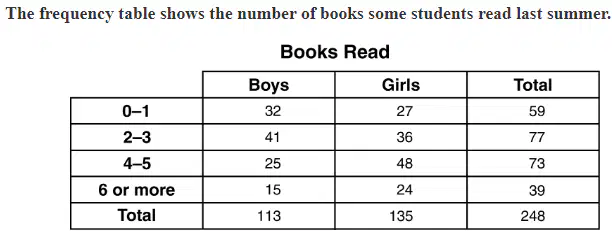
Based on the data in the table, which statement is true?
Six more boys read 2 – 3 books than girls who read 2 – 3 books.
Exactly twice as many boys read 0 – 1 book than read 6 or more books.
Twice as many girls read 6 or more books than girls who read 4 – 5 books.
Nine more girls read 6 or more books than boys who read 6 or more books.
18
Multiple Choice
Based on the table, which statement is true?
The fewest number of coupons given were 15%-off coupons in the afternoon.
The greatest number of coupons given were 20%-off coupons in the afternoon.
Customers were given 25% more coupons in the afternoon than in the evening.
Customers were given more coupons in the evening than they were given in the morning.
19
Building Another Type
of Two-Way Table
Comprehend/Apply: Activity 9.3
● Think Pair Share
● MLR2: Collect and Display
20
Based on this data, who is more likely to watch the news
daily: someone who is younger than 18 or someone who
is 18 or older?
21
Based on the numbers in the table, there are more
younger people who watch news (30) than older (10).
On the other hand, the survey reached out to 110 young
people and only 15 older people. Without looking at the
whole table, that information may have been missed.
22
In cases like this, finding a relative frequency including
percentages can be more helpful than looking at the
actual frequency. Let’s try it!
23
24
●
What does 42% in the table mean?
●
What is the total of percentages in the first column? What’s
wrong with that answer?
Organize: Activity Synthesis
25
● Did you say there was or was not an association
between age and cell-phone use? Explain.
● What did the relative frequency table show you that
was harder to see in the original two-way table?
26
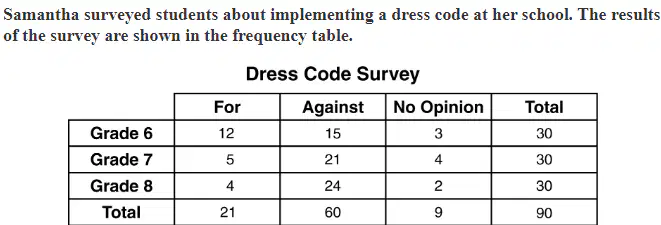
Let's continue practicing identifying data in a frequency table. This time, we will include percentages.
27
Multiple Choice
What percent of seventh graders are against implementing a dress code?
HINT: against/total
17%
23%
35%
70%
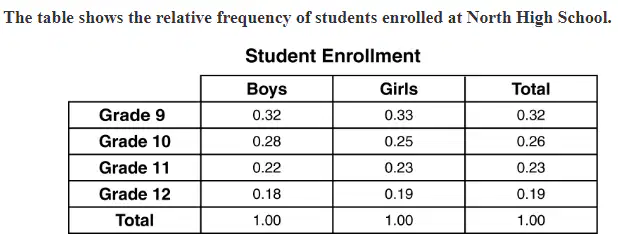
28
Multiple Choice
Based on the data, which statement must be true?
There are 3 more boys in grade 10 than girls.
Exactly half of the boys are in grades 11 and 12.
The percentage of students decreased from grade 9 to grade 12.
The number of girls is greater in each grade than the number of boys.
29
Multiple Choice
Which value is closest to the percentage of the Grade 7 students enrolled in French or German?
HINT: Focus only on the total students for 7th grade.
23
28
47
64
30
Multiple Choice
What fraction of student bowlers in Grade 7 used a 13-pound bowling ball?
HINT: Change decimal to a fraction.
61
51
52
32
31
Today’s Goals
❏ I can identify the same data represented in a bar graph, a
segmented bar graph, and a two-way table.
❏ I can use a two-way frequency table or relative frequency
table to find associations among variables.
Looking for
Associations
Lesson 9
Download for free at openupresources.org.
2019 Open Up Resources |
Show answer
Auto Play
Slide 1 / 31
SLIDE

Similar Resources on Wayground
22 questions
Direct Variation
Presentation
•
8th - 9th Grade
21 questions
Exponent Properties Review
Presentation
•
8th Grade
24 questions
Intro to Transformations
Presentation
•
8th Grade
25 questions
Week 9 Assignment 1: Intro to Dilations
Presentation
•
8th Grade
22 questions
scientific notation
Presentation
•
8th Grade
22 questions
Exponent Rules Review
Presentation
•
8th Grade
22 questions
Rotations (Week 17)
Presentation
•
8th Grade
23 questions
Coordinate Plane & Plotting Points Review
Presentation
•
8th Grade
Popular Resources on Wayground
10 questions
Safety Day 2026 – Student Review
Quiz
•
9th Grade
21 questions
Continents and Oceans
Quiz
•
6th Grade
20 questions
Parts of Speech
Quiz
•
5th Grade
16 questions
Subject & Predicate
Quiz
•
5th Grade
25 questions
Multiplication Facts
Quiz
•
5th Grade
12 questions
Map Skills
Quiz
•
3rd Grade
22 questions
Continents and Oceans
Quiz
•
5th Grade
15 questions
Rounding Decimals
Quiz
•
5th Grade
Discover more resources for Mathematics
20 questions
Rational and Irrational Numbers
Quiz
•
8th Grade
20 questions
Add and Subtract Integers
Quiz
•
6th - 8th Grade
20 questions
Slope from a Graph
Quiz
•
8th Grade
15 questions
Adding and Subtracting Integers
Quiz
•
6th - 8th Grade
20 questions
Proportional vs. Non-Proportional
Quiz
•
8th Grade
14 questions
finding slope from a graph
Quiz
•
8th Grade
24 questions
Explore Rigid Transformations and Congruence
Quiz
•
8th Grade
13 questions
Finding slope from graph
Quiz
•
8th Grade