
Box and Whisker Graphs
Presentation
•
Mathematics
•
•
Practice Problem
•
Easy
Allison James
Used 20+ times
FREE Resource
7 Slides • 27 Questions
1
Title: Boxplots
WARM UP: WRITE THIS IN YOUR NOTES, draw the picture, and write the definitions :
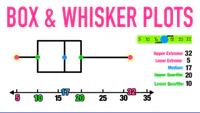
Boxplots show the "five number summary" of the data, dividing the data into quarters (25%).
Minimum: The lowest value of the data set
First Quartile (Q1): Middle of the lower half of the data set. 25% of the data lies below this value and 75% lies above.
Median: Middle of the data set. Half the data (50%) lies below this value and half (50%) lies above.
Third Quartile (Q3): Middle of the upper half of the data set. 75% of the data lies below this value and 25% lies above.
Maximum: The highest value of the data set.
2
Two additional pieces of information that can be determined are:
The Interquartile Range (IQR) = Q3 - Q1
The Range = Max - Min
These pieces of information will show the extent to which the data is located near the center or near the extremes of the data set.
Measures of Spread
3
Match
Match the following terms with their definitions
Minimum (Min)
First Quartile (Q1)
Median (Q2)
Third Quartile (Q3)
Maximum (Max)
The lowest value of the data set
Middle of the lower half of the data set. 25% of the data lies below this value and 75% lies above.
Middle of the data set. Half the data (50%) lies below this value and half (50%) lies above.
Middle of the upper half of the data set. 75% of the data lies below this value and 25% lies below.
The highest value of the data set
The lowest value of the data set
Middle of the lower half of the data set. 25% of the data lies below this value and 75% lies above.
Middle of the data set. Half the data (50%) lies below this value and half (50%) lies above.
Middle of the upper half of the data set. 75% of the data lies below this value and 25% lies below.
The highest value of the data set
4
Multiple Choice
What do points B and D represent on the box plot?
Mean and Mode
Mean and Median
Least and Greatest Value
First and Third Quartiles
5
Multiple Choice
What do points A and E represent on the box plot?
Mean and Mode
Mean and Median
Least and Greatest Value
First and Third Quartiles
6
Multiple Choice
What does point C on the box plot represent?
First Quartile
Median
Third Quartile
Mean
7
Multiple Choice
What is the median of the data?
200
100
90
140
8
Multiple Choice
What value is the lower quartile?
66
58
60
64
9
Multiple Choice
What data value is the upper quartile (Q3)?
64
62
66
58
10
Example for your notes:
11
Multiple Choice
Now lets find the median, what do you do to find it?
Cross off my numbers in pairs until I get one or two in the middle
Add all of my numbers together
Find the most common one
Subtract the largest and smallest
12
Multiple Choice
We have two numbers in the center, what do we do to find the median?
Nothing, we have two medians
Add them and divide by 2
We choose the one we like the most
13
Fill in the Blanks
Type answer...
14
15
16
17
Multiple Choice
What is the interquartile range? (Q3 - Q1)
33
11
26
23
18
Multiple Choice
Which of the films do you think you would not be allowed to legally watch at the cinema?
Film A
Film B
Film C
Cannot tell
19
Multiple Choice
What percentage of film B’s audience were between 15 and 30 (the box)?
25%
50%
75%
Cannot tell
20
Multiple Select
Which of these comparisons are correct?
Boys weigh more than girls on average
The lightest girl is lighter than the lightest boy
The heaviest boy is the same weight as the heaviest girl
Girls weight is less consistent than boys
21
Multiple Choice
64
58
66
60
22
Multiple Choice
58
66
64
60
23
Multiple Choice
64
62
66
58
24
Multiple Choice
66
58
60
64
25
Multiple Choice
62
58
66
60
26
Multiple Choice
Millersburg
Arcadia
27
Multiple Choice
15
93
85
78
28
Multiple Choice
70
65
80
55
29
Multiple Choice
Which plot has a median of 50?
Plot 1
Plot 2
Plot 3
Plot 4
30
Multiple Choice
Which class has the highest test score?
1st Period
2nd Period
31
Multiple Choice
4
64
60
8
32
Multiple Choice
25%
50%
75%
100%
33
Multiple Choice
75%
50%
100%
25%
34
The Rest of Class - Homework
You can get in groups and work together on this.
Due next class
If you finish work on IXL
Homework Packet
Choose any that seem hard for you.
Try and get at least 2 done to above 50%
IXL
Title: Boxplots
WARM UP: WRITE THIS IN YOUR NOTES, draw the picture, and write the definitions :
Boxplots show the "five number summary" of the data, dividing the data into quarters (25%).
Minimum: The lowest value of the data set
First Quartile (Q1): Middle of the lower half of the data set. 25% of the data lies below this value and 75% lies above.
Median: Middle of the data set. Half the data (50%) lies below this value and half (50%) lies above.
Third Quartile (Q3): Middle of the upper half of the data set. 75% of the data lies below this value and 25% lies above.
Maximum: The highest value of the data set.
Show answer
Auto Play
Slide 1 / 34
SLIDE

Similar Resources on Wayground
26 questions
Operations with Rational Numbers
Presentation
•
7th Grade
26 questions
Properties of Logarithms
Presentation
•
11th - 12th Grade
27 questions
Percents Review
Presentation
•
6th - 7th Grade
27 questions
Lesson on Factoring GCF and Difference of Two Squares
Presentation
•
9th - 12th Grade
27 questions
Factoring Perfect Square Trinomials
Presentation
•
8th Grade
26 questions
Features of Parabolas
Presentation
•
8th - 9th Grade
26 questions
Notes on Compound Inequalities
Presentation
•
9th - 12th Grade
26 questions
Characteristics of Exponential and Logarithmic Functions
Presentation
•
9th - 12th Grade
Popular Resources on Wayground
24 questions
PBIS-HGMS Day 10
Quiz
•
6th - 8th Grade
10 questions
HCS SCI 03 Summer School Review 3
Quiz
•
3rd Grade
11 questions
Home Scope
Quiz
•
7th - 8th Grade
15 questions
HCS SCI 05 Summer School Assessment 3 Review
Quiz
•
5th Grade
35 questions
Lufkin Road Middle School Student Handbook & Policies Assessment
Quiz
•
7th Grade
18 questions
Geo 11.3 Area of Circles and Sectors
Quiz
•
9th - 11th Grade




