
7.SP.4-7 Supporting 4/20/23
Presentation
•
Mathematics
•
•
Practice Problem
•
Hard
Carlos Mendes
Used 1+ times
FREE Resource
3 Slides • 22 Questions
1
Multiple Select
Which are true based on the boxplots?
The median distance at the Olympics is higher than at U.S. qualifying
There is greater variability among U.S. qualifiers
The centers of the data sets are similar
It is not likely the U.S. won this event
2
Multiple Choice
Use the dot plots representing the number of siblings of students in each class.
Visually Compare the 2 Dot Plots
All the data are 7 siblings or fewer; There is a greater spread in the number of siblings in Mr. Walker’s class.
All the data are 7 siblings or fewer; There is a greater spread in the number of siblings in Mr. Whites’s class.
All the data are 6 siblings or fewer; There is a greater spread in the number of siblings in Mr. Walker’s class.
All the data are 6 siblings or fewer; There is a greater spread in the number of siblings in Mr. Whites’s class
3
Multiple Choice
Compare the shapes of the box plots.
Overall the scores of Class A are slightly higher, and the ranges of the box plots appear to be very similar.
Overall the scores of Class B are slightly higher, and the ranges of the box plots appear to be very similar.
Overall the scores of Class A are slightly higher, and the ranges of the box plots appear to be very far different.
Overall the scores of Class B are slightly higher, and the ranges of the box plots appear to be very far different.
4
Multiple Choice
Consider the two number sets. Which set has a higher mean and what is that mean?
Set 1: 10, 15, 20, 25, 30, 50
Set 2: 2,15, 22, 30, 42
Set 1: 50
Set 1: 25
Set 2: 42
Set 2: 30
5
Multiple Choice
In the table, Asher recorded the number of shots attempted and the number of shots made in five basketball games. What is the difference between the median number of shots attempted and the median number of shots made?
15
14
13
11
6
Multiple Choice
7
Multiple Choice
Two teammates were comparing data from five basketball games.
Tyler scored 10, 14, 8, 12, and 11 points.
Mason scored 7, 12, 9, 11, and 16 points.
When comparing each boy's points, which measure(s) have a value of 11?
range of Tyler's points
range of Mason's points
mean and mode of both boys' points
mean and median of both boys' points
8
Multiple Select
Probabilities are expressed as ratios of the number of times that an event occurs to the total number of trials that are conducted.
True
False
9
Multiple Choice
probability can be represented by all of the answers below except ___________
Fraction
Decimal
Percent
Triangle
10
Multiple Choice
The cafeteria staff made sandwiches. Each sandwich had either rye or white bread, either ham or turkey, and either cheese or no cheese. The staff made an equal number of each type of sandwich. The sandwiches were placed on a tray. Without looking, Mary will choose a sandwich. What are the chances that Mary will get a sandwich with cheese?
1/8
1/6
1/3
1/2
11
Multiple Choice
A player for a football team gets injured and
leaves the game. The coach says there is a 9/10
chance that the player will not play for the rest of
the game. How likely is it that the player will be
able to return to the game?
unlikely
likely
certain
impossible
12
Multiple Choice
Sophie is at the market to purchase apples. She buys 4 red apples and 1 green apple.
If Sophie picks an apple at random to eat, what is the probability that she would pick a red apple?
3/4
4/5
1/3
1/5
13
Multiple Choice
14
Multiple Choice
Which event is least likely to occur?
spinning a 3 on a spinner divided into 3 equal sections numbered 1-3
rolling an even number on a number cube that has sides numbered 1-6
tossing a fair coin and landing on heads
picking a green marble from a bag that contains 2 orange, 10 green, and 7 purple
15
How likely is something?
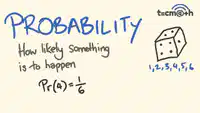
Likelihood is expressed as a fraction or a decimal from 0 to 1.
0 means that the event is impossible
In between 0 and 1/2 or 0.5 means the event is unlikely to happen.
In between 1/2 or 0.5 and 1 means the event is likely to happen.
1 means that the event will happen every time
Some text here about the topic of discussion
16
How to build a probability
Probability is a way to put a number on how likely an event is. The easiest way to build a probability is as a fraction.
In the numerator put the number of times the event gives the results that you desire.
In the denominator put the total number of possible outcomes.
Some text here about the topic of discussion
17
Example: How to build a probability
There is a bag with 10 marbles; 5 blue, 3 red, and 2 green. What is the probability of picking out a red marble?
Start with the denominator - how many total marbles? 10
Then count up how many total are the desired color, red? 3
Build a fraction. How many of what you are looking for over the total number.
3 red out of 10 total or 3/10
Some text here about the topic of discussion
18
Multiple Choice
There is a bag with 10 marbles; 5 blue, 3 red, and 2 green. Would it be correct to say that getting a green marble would be unlikely?
Yes
No
I don't know
19
Multiple Choice
LEVEL 2 - The following spinner is spun 20 times and lands on red 4 times. What is the relative frequency of the spinner landing on red? Write your answer as a decimal.
4
0.4
0.2
5
20
Multiple Choice
LEVEL 3 - A die is rolled 30 times and 8 of those times it lands on 2.
What is the experimental probability of landing on 2 as a decimal? Round if needed.
0.27
0.07
0.25
3.75
21
Multiple Choice
LEVEL 4 - You are looking for the experimental probability of a coin landing on tails. Without knowing the results, which experimental probability should be more accurate? Explain.
a. Flipping a coin 10 times and recording how many times it lands on tails.
b. Flipping a coin 100 times and recording how many times it lands on tails.
Flipping a coin 10 times because it has less experiments.
Flipping a coin 10 times because it won't take as long.
Flipping a coin 100 times because it has more experiments.
Flipping a coin 100 times because 100 can be divided by more numbers than 10.
22
Multiple Choice
In a game, the probability of winning is 1 out of 5. How many times could Lisa expect to win if she plays the game 85 times?
17
34
68
80
23
Multiple Choice
Jennifer will spin the spinner 600 times. About how many times should Jennifer expect the spinner to land on a 2?
75
150
200
300
24
Multiple Choice
What is the probability of flipping a coin
3 times and getting 3 heads?
1/8
1/4
1/2
3/4
25
Multiple Choice
The spinner was spun 30 times and landed on blue 12 times. What was the experimental probability of the spinner landing on colors that were not blue?
2/5
3/5
4/5
1/5
Which are true based on the boxplots?
The median distance at the Olympics is higher than at U.S. qualifying
There is greater variability among U.S. qualifiers
The centers of the data sets are similar
It is not likely the U.S. won this event
Show answer
Auto Play
Slide 1 / 25
MULTIPLE SELECT

Similar Resources on Wayground
20 questions
BUDGETING
Presentation
•
University
20 questions
Fraction Introduction
Presentation
•
5th Grade
20 questions
Polynomial factoring review
Presentation
•
10th - 12th Grade
20 questions
Word Problems - Linear Functions
Presentation
•
9th Grade
20 questions
Fraction-Of Whole Numbers
Presentation
•
4th - 5th Grade
20 questions
Increasing, Decreasing, Positive, and Negative Intervals
Presentation
•
8th - 12th Grade
20 questions
Regrouping with Addition
Presentation
•
2nd - 4th Grade
20 questions
Percents Review
Presentation
•
7th Grade
Popular Resources on Wayground
10 questions
Safety Day 2026 – Student Review
Quiz
•
9th Grade
21 questions
Continents and Oceans
Quiz
•
6th Grade
20 questions
Parts of Speech
Quiz
•
5th Grade
16 questions
Subject & Predicate
Quiz
•
5th Grade
25 questions
Multiplication Facts
Quiz
•
5th Grade
12 questions
Map Skills
Quiz
•
3rd Grade
22 questions
Continents and Oceans
Quiz
•
5th Grade
15 questions
Rounding Decimals
Quiz
•
5th Grade