
Search Header Logo
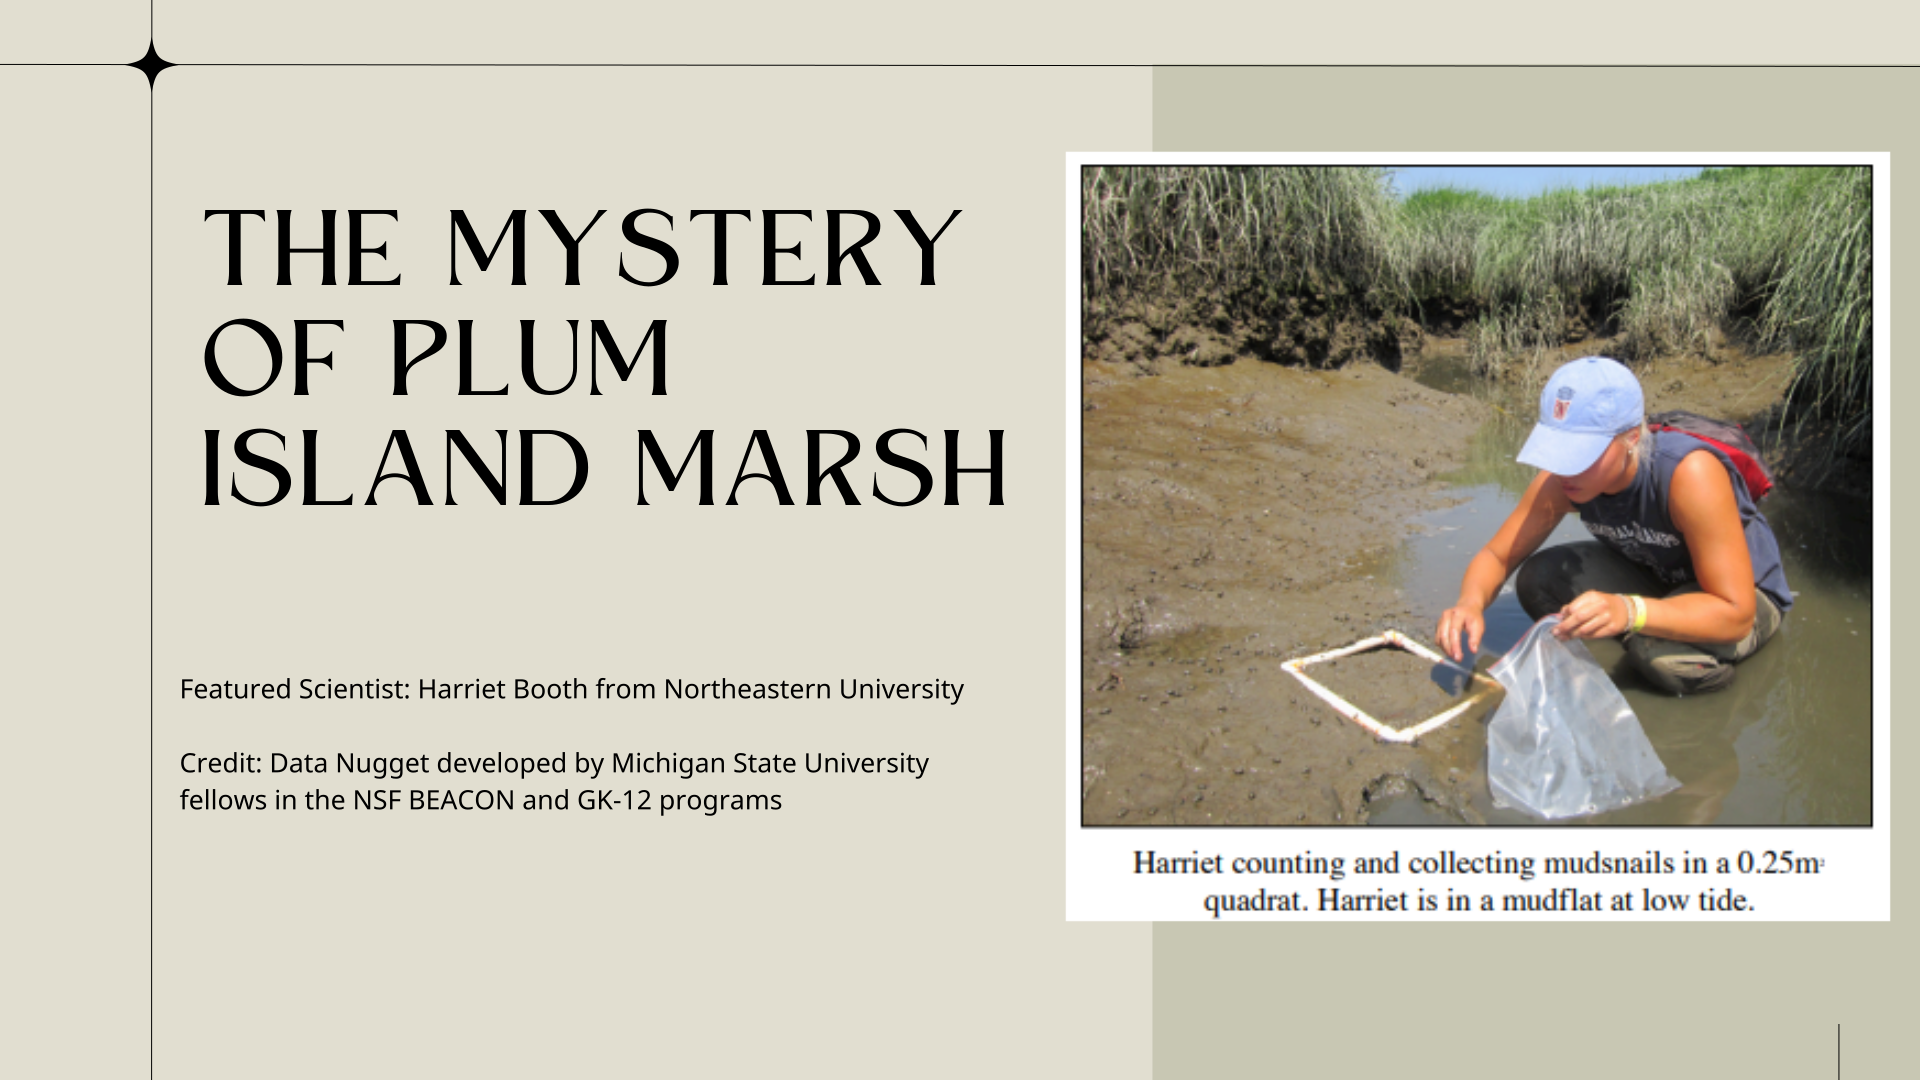
The Mystery of Plum Island Marsh

The Mystery of Plum Island Marsh

Assessment

Presentation

•

Science

•

9th - 12th Grade

•

Practice Problem

•

Medium

•
NGSS
MS-LS2-1, MS-LS2-4, MS-LS2-3

Standards-aligned

Created by

Hope Mclendon

Used 6+ times

FREE Resource

6 Slides • 12 Questions

1
media

2

media

3

media

4

media

5

media

6

Draw a food web for the creek ecosystem:

  • As your final step, draw a box labeled "fertilizer" and draw an arrow to show where fertilizer enters the food web.

  • Include algae, snails, invertebrates, and fish in your food web. Draw and write out the name of each species and put a box around it.

  • Add arrows to connect the organisms. Arrows represent the interactions between biotic factors.

7

Open Ended

What did the scientists hypothesize about what was causing the decline in the fish populations?

8

Dropdown

Question image
The "Creek Type" is considered the


9

Dropdown

Question image
The "Density of Mudsnails" and the "Density of Invertebrates" are both considered the

​

10

Fill in the Blanks

media image

The average snail density per meter squared in fertilized mudflats is

Type answer...

snails.

11

Fill in the Blanks

media image

The average snail density per meter squared in unfertilized control mudflats is

Type answer...

snails.

12

Fill in the Blanks

media image

The average invertebrate density per meter squared in fertilized mudflats is

Type answer...

invertebrates.

13

Fill in the Blanks

media image

The average invertebrate density per meter squared in unfertilized control mudflats is

Type answer...

invertebrates.

14

Draw

Identify any changes, trends, or differences you see in the graphs. Draw arrows pointing out what you see, and write one sentence on your paper per arrow describing what you see next to each arrow.

15

Open Ended

Make a claim that answers the scientific question: Is there any evidence that mudsnails are causing the decline in fish populations through their effects on invertebrate populations?

16

Open Ended

What evidence was used to write your claim? Reference specific parts of the table or graphs.

17

Open Ended

Explain your reasoning and why the evidence supports your claim. Connect the data back to what you learned about the salt marsh food web and how fertilizer may affect the system.

18

Open Ended

Did the data support Harriet’s “mudsnail hypothesis”? Use evidence to explain why or why not. If you feel the data was inconclusive, explain why.

pattern-tertiary
media

Show answer

Auto Play

Slide 1 / 18

SLIDE
