Scatter Plots Review
Presentation
•
Mathematics
•
KG
•
Easy
+3
Standards-aligned
Used 8+ times
FREE Resource
7 Slides • 27 Questions
1
Scatter Plots
This is for students that missed class on Monday, March 7. Please complete these slides to catch up on material.
2
A scatter plot is a graph that is used to show data between two variables, also known as bivariate data.
For ex: height and weight.
Scatter plots show patterns, trends, and associations between variables that could impact each other.
Scatter Plots
3
Positive Association | Negative Association | No Association |
|---|---|---|
Both variables are increasing. | One variable is increasing, the other is decreasing. | There is no relationship between the variables. |
Types of Association
4
Multiple Choice
positive
negative
none
all of the above
5
Multiple Choice
What kind of correlation?
Positive
Negative
No
6
Multiple Choice
What kind of correlation?
Positive
Negative
No
7
Multiple Choice
Can you guess the correlation?
Positive
Negative
None
8
9
Multiple Choice
Positive, strong
Positive, weak
Negative, strong
Negative weak
10
Multiple Choice
Which graph depicts the strongest positive correlation?
11
Multiple Choice
Weak positive correlation
Weak negative correlation
Strong positive correlation
Strong negative correlation
12
Multiple Choice
This scatter plot is almost a line. What can you say about it?
Strong positive
Weak positive
Strong negative
Weak negative
13
Multiple Choice
What kind of correlation is this?
Strong positive
Weak positive
Strong negative
Weak negative
14
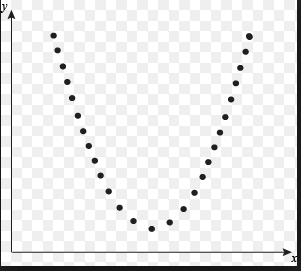
Scatter Plots can be described as linear and non-linear models. They are not perfectly linear or non-linear but they follow a trend.
Linear vs. Non-linear Models
15
Multiple Choice
Graph A
Graph B
Graph C
Graph D
16
Multiple Choice
Which best describes the form of this scatterplot?
linear
nonlinear
scattered
no correlation
17
Multiple Choice
positive linear association
negative association
no association
nonlinear association
18
Multiple Choice
Is this scatterplot Linear or NonLinear
Linear
Non Linear
19
Multiple Choice
Is this scatterplot Linear or NonLinear
Linear
Non Linear
20
Outliers | Clusters |
|---|---|
An outlier is a data point in a scatter plot that does not follow the trend of the data. | A group of data points that are closely grouped together. |
outlier
cluster
21
Multiple Choice
What are the coordinates of the outlier?
(1,9)
(9,1)
(2,2)
y=x
22
Multiple Choice
Is the point in red an outlier?
Yes
No
23
Multiple Choice
Identify any outliers.
Outlier at x = 18
Outlier at x = 12
Outlier at x = 6
There aren't any outliers in this graph.
24
Multiple Choice
...is something we didn't learn in 8th grade
...is a point on the origin
...is a point that is far outside the main cluster of points/ordered pairs
...is a group of points that are close together
25
Multiple Choice
What kind of slope would the graph of the model have? Read the answers carefully.
Positive
Negative
There's no association
Positive with an outlier
26
Multiple Choice
positive linear association
negative linear association
no association
nonlinear association
27
Multiple Choice
Which best describes the association shown in the scatter plot below?
Negative and linear
Negative and non-linear
Positive and linear
Positive and non-linear
28
To show the overall trend of a data set, we can use a Line of Best Fit.
A line of best fit should:
Follow the trend of the data
Split the data in half
Help to estimate or predict values that are not already given in the set.
Line of Best Fit
29
Multiple Choice
30
Multiple Choice
A
B
C
D
31
Multiple Choice
Is this line an accurate line estimate of best fit for the data?
Yes
No
32
Multiple Choice
which scatterplot shows the correct trend line (line of best fit) for the relationship showing the number of bags of chocolates that are sold and the price per bag?
A
B
C
D
33
Multiple Choice
A
B
C
D
34
Multiple Choice
which scatterplot shows the correct trend line (line of best fit) for the relationship showing the number of Visitors of a library and the number of books checked out?
W
X
Y
Z
Scatter Plots
This is for students that missed class on Monday, March 7. Please complete these slides to catch up on material.
Show answer
Auto Play
Slide 1 / 34
SLIDE

Similar Resources on Wayground
25 questions
Exploring Exponential Models
Presentation
•
10th - 12th Grade
25 questions
Function Families
Presentation
•
7th - 9th Grade
25 questions
Solving Linear Equations Review
Presentation
•
9th - 10th Grade
28 questions
Multiply and divide integers
Presentation
•
6th - 8th Grade
29 questions
Scatterplot and line of fit review
Presentation
•
8th Grade
27 questions
One Step Inequalities
Presentation
•
7th - 10th Grade
26 questions
Adding and subtracting rational numbers
Presentation
•
7th Grade
27 questions
Proportional Relationships: Reading Graphs
Presentation
•
8th Grade
Popular Resources on Wayground
10 questions
HCS SCI 03 Summer School Review 4
Quiz
•
3rd Grade
11 questions
HSMS - Standard Response Protocol
Quiz
•
6th - 8th Grade
16 questions
1.1-1.2 Quiz Review
Quiz
•
9th - 12th Grade
12 questions
Exponent Expressions
Quiz
•
6th Grade
20 questions
Adding and Subtracting Integers
Quiz
•
6th - 7th Grade
11 questions
Northeast States
Quiz
•
3rd - 4th Grade
10 questions
Characterization
Quiz
•
3rd - 7th Grade
10 questions
Common Denominators
Quiz
•
5th Grade