Data and Statistics Test Review
Presentation
•
Mathematics
•
7th Grade
•
Medium
+4
Standards-aligned

Raeanna Randolph
Used 19+ times
FREE Resource
6 Slides • 29 Questions
1
Data and Statistics Test Review
2
Measures of Center and Spread
Mean: Average -- add all the numbers up and divide by how many numbers you have
Median: Middle -- cross out numbers on each side until you get to the middle. If there are two numbers in the middle, add them together and divide by two.
Mode: Most occurring -- see which number appears the most. There may be two modes
Range: Distance between the largest and smallest number -- Subtract the smallest number from the largest number
3
Multiple Choice
12, 5, 9, 18, 22, 25, 5
4
Multiple Choice
The number of miles that Jenna cycled each week for a 7-week period is shown:
36, 42, 28, 52, 48, 36, 31
What is the median number of miles Jenna cycled?
24
36
39
52
5
Multiple Choice
Roger has the following data:
12, 10, 3, 5, 6
Susan has the following data:
5, 9, 4, 5, 6
Who has the data with the highest median and what is it?
Roger - 6
Susan - 7
Roger - 8
Susan - 5.5
6
Multiple Choice
What is the mean of the following set of data?
2, 6, 10, 31, 14, 8
11.8
71
12
14.2
7
Multiple Choice
What is the median of the following data set?
25, 42, 36, 12, 19
36
25
39
26.5
8
Mean Absolute Deviation
Step One: Find the mean
Step Two: Find the distances from the mean
Step Three: Find the mean of the distances
The higher the MAD the more variation or spread in the data
9
Multiple Choice
Find the MAD:
58, 38, 54, 48, 26, 36
43
20
10
12
10
Multiple Choice
11
Multiple Choice
Find the Mean Absolute Deviation: (MAD)
10, 9, 3, 8, 10.
3
5
1
2
12
Multiple Choice
13
Multiple Choice
Find the Mean Absolute Deviation: 5, 11, 2, 7, 16. The Mean is 8.2
3.2
2.8
1.2
4.2
14
Box Plots
Show median, lower quartile (Q1), upper quartile (Q3), minimum and maximum
Interquartile Range (IQR) = Q3 - Q1
The lower quartile is the median of the data below/to the left of the median
The upper quartile is the median of the data above/to the right of the median
15
Multiple Choice
What is the interquartile range (IQR)?
20
25
30
50
16
Multiple Choice
Which box and whisker plot has the highest median?
Top plot
Bottom plot
17
Multiple Choice
18
Multiple Choice

What is the minimum value?
64
58
66
60
19
Multiple Choice
What value is the lower quartile?
66
58
60
64
20
Dot Plots
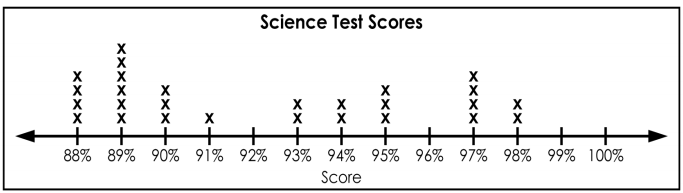
Use the dot plot to write down the data points, then solve for mean, median, or MAD
21
Multiple Choice
22
Multiple Choice
What is the difference between the highest score and the lowest score on the test?
15
100
6
10
23
Multiple Choice
How many students spent 7 hours doing homework that week?
1
3
5
6
24
Let's Practice
All types of test questions
25
Multiple Choice
The double dot plot shows the number of city pet registrations for several days.
The mean number of cat registrations is greater than the mean number of dog registrations.
The dogs’ data has a mean of 10 registrations.
The cats’ data has a mean of 15 registrations.
The mean number of dog registrations is greater than the mean number of cat registrations.
26
Multiple Choice
Find the Mean Absolute Deviation: (MAD)
10, 9, 3, 8, 10.
3
5
1
2
27
Multiple Choice
Find the MAD of the following data sets: $29, $58, $15, $129, $75, $22
196
54.7
114
32.67
28
Multiple Choice
Which restaurant has a higher median wait time?
Lucy's Steakhouse
Gary's Grill
They are the same
29
Multiple Choice
Which has a greater interquartile range?
Airplane A
Airplane B
Both the same
30
Multiple Choice
Which car club has the higher median?
Cruisers
Car Hops
Neither, they are the same
31
Multiple Choice
What is the IQR of the Cruisers?
4
6
13
9
32
Multiple Choice
33
Multiple Choice
34
Multiple Choice
The double dot plot shows the gas mileage, in miles per gallon, for several cars and SUVs.
The cars have a greater gas mileage with a greater variation.
The cars have a greater gas mileage with a less variation.
SUVs have less gas mileage with greater variation.
SUVs are centered around a greater median.
35
Multiple Choice
The double dot plot shows the gas mileage, in miles per gallon, for several cars and SUVs.
The cars have a greater gas mileage with a greater variation.
The cars have a greater gas mileage with a less variation.
SUVs have less gas mileage with greater variation.
SUVs are centered around a greater median.
Data and Statistics Test Review
Show answer
Auto Play
Slide 1 / 35
SLIDE

Similar Resources on Wayground
32 questions
Metric System
Presentation
•
7th - 8th Grade
24 questions
7.NS.1 Quiz (Adding and Subtracting Integers
Presentation
•
7th Grade
27 questions
Mean, Median, Mode, & Range
Presentation
•
7th Grade
31 questions
Simple Probability
Presentation
•
7th Grade
25 questions
Independent Compound Probability Lesson
Presentation
•
7th Grade
25 questions
4/25 Random Sampling
Presentation
•
7th Grade
33 questions
Scientific Notation
Presentation
•
7th Grade
29 questions
Geometry review
Presentation
•
7th Grade
Popular Resources on Wayground
24 questions
PBIS-HGMS Day 10
Quiz
•
6th - 8th Grade
10 questions
HCS SCI 03 Summer School Review 3
Quiz
•
3rd Grade
11 questions
Home Scope
Quiz
•
7th - 8th Grade
15 questions
HCS SCI 05 Summer School Assessment 3 Review
Quiz
•
5th Grade
35 questions
Lufkin Road Middle School Student Handbook & Policies Assessment
Quiz
•
7th Grade
18 questions
Geo 11.3 Area of Circles and Sectors
Quiz
•
9th - 11th Grade