
Data practice
Presentation
•
Mathematics
•
7th Grade
•
Medium
+6
Standards-aligned
Heather Ruiz
Used 88+ times
FREE Resource
5 Slides • 13 Questions
1
Data practice
Box plots
Dot plots
Bar graphs
Circle graphs
2
Multiple Choice
What was the most number of books read?
1
6
9
12
3
Multiple Choice
4
Take a moment and look at these graphs.
Write down the:
Mode
Median
Range
Mean
5
Multiple Choice
Which statement is support by the data shown?
The mode of the data for Store 2 is greater than the mode of the data for Store 1.
The range of the data for Store 1 is greater than the range of the data for Store 2.
The mean of the data for Store 1 is greater than the mean of the data for Store 2.
The median of the data for Store 2 is greater than the median of the data for Store 1.
6
Multiple Choice
The graph shows the number of colored beads used to make a necklace. How many purple and green beads were used in all?
23
20
18
15
7
Multiple Choice
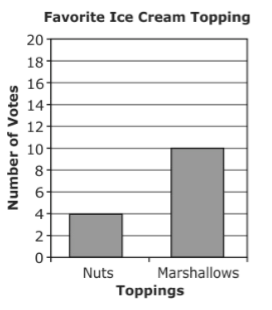
Students voted for their favorite ice cream topping. How many more students chose marshmallows than chose nuts?
4
6
10
8
Read the bar graph.
Write down the total number surveyed and how many chose each fruit.
9
Multiple Choice
Which statement is true about the graph shown?
Pears were chosen half as much as oranges.
50% of students chose apples
Oranges and strawberries combined are equal to apples and bananas combined.
Grapes were chosen twice as often as strawberries.
10
Multiple Choice
According to this graph, what is the most popular flavor of Jolly Rancher?
Cherry
Grape
Blue Rasberry
Watermelon
11
Multiple Choice
What percentage does a whole circle graph represent?
360%
90%
50%
100%
12
Find the number of students who voted for each type of sport.
Set up a proportion to solve each.
% x
100 250
13
Fill in the Blanks
Type answer...
14
Multiple Choice
Which best represents the Interquartile Range
15
93
85
78
15
Multiple Choice
What is the median?
62
58
66
60
16
Read the box plots.
Write down the:
Median
Range
IQR (interquartile range)
17
Multiple Choice
Which statement is correct?
The range of the data for men 20-40 years old is less than the range of the data for men 50-70 years old.
The median of the data for men 20-40 years old is less than the median of the data for men 50-70 years old.
The minimum target heart rate for men 20-40 years old is less than the minimum target heart rate for men 50-70 years old.
The interquartile range of the data for men 20-40 years old is greater than the interquartile range of the data for men 50-70 years old.
18
Multiple Choice
Name this character
Superman
Batman
Darna
Barney
Data practice
Box plots
Dot plots
Bar graphs
Circle graphs

Show answer
Auto Play
Slide 1 / 18
SLIDE

Similar Resources on Wayground
14 questions
Adding and Subtracting Decimals
Presentation
•
7th Grade
14 questions
7.RP.3
Presentation
•
7th Grade
14 questions
Subtract Linear Expressions
Presentation
•
7th Grade
13 questions
Triangle Theorems
Presentation
•
7th Grade
13 questions
12/10: Distributive Property
Presentation
•
7th Grade
13 questions
Solving Two-Step Inequalities
Presentation
•
7th Grade
13 questions
Intro to Like Terms
Presentation
•
7th Grade
13 questions
Improper and Mixed
Presentation
•
7th Grade
Popular Resources on Wayground
24 questions
PBIS-HGMS Day 10
Quiz
•
6th - 8th Grade
10 questions
HCS SCI 03 Summer School Review 3
Quiz
•
3rd Grade
11 questions
Home Scope
Quiz
•
7th - 8th Grade
15 questions
HCS SCI 05 Summer School Assessment 3 Review
Quiz
•
5th Grade
35 questions
Lufkin Road Middle School Student Handbook & Policies Assessment
Quiz
•
7th Grade
18 questions
Geo 11.3 Area of Circles and Sectors
Quiz
•
9th - 11th Grade