
Unit 2.4 test review P1

Flashcard
•
Mathematics
•
12th Grade
•
Practice Problem
•
Hard

Wayground Content
FREE Resource
Student preview

15 questions
Show all answers
1.
FLASHCARD QUESTION
Front
TRUE or FALSE: There are two types of standard deviation: population and sample.
Back
True
2.
FLASHCARD QUESTION
Front
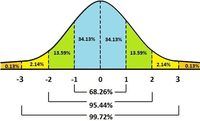
This data is normally distributed. What percent of the data is in the shaded region?
Back
0.3% (This represents the tails of the normal distribution outside of 3 standard deviations from the mean.)
3.
FLASHCARD QUESTION
Front
Find the mean of these numbers: 5, 11, 2, 12, 4, 2
Back
6 (Mean is calculated by summing all numbers and dividing by the count.)
4.
FLASHCARD QUESTION
Front
What is the standard deviation for the data given: 5, 10, 7, 12, 0, 20, 15, 22, 8, 2?
Back
6.89 (Standard deviation measures the amount of variation or dispersion in a set of values.)
5.
FLASHCARD QUESTION
Front
The ages of the population of people living in Meru area in Ipoh are Normally distributed with mean 43 and standard deviation 14. How many would you expect to be aged between 22 and 57?
Back
3870 (Use the standard normal distribution to find the proportion of the population within this age range.)
6.
FLASHCARD QUESTION
Front
Define standard deviation.
Back
Standard deviation is a measure of the amount of variation or dispersion in a set of values.
7.
FLASHCARD QUESTION
Front
What is the formula for calculating the mean?
Back
Mean = (Sum of all values) / (Number of values)
Access all questions and much more by creating a free account
Create resources
Host any resource
Get auto-graded reports

Continue with Google

Continue with Email

Continue with Microsoft
or continue with

%20(1).png)
Apple

Others
By signing up, you agree to our Terms of Service & Privacy Policy
Already have an account?

